mebioda
Introduction to biodiversity and data science
What is biodiversity?
- Species diversity
- Number of species in an ecological community, landscape or region
- Perhaps taking abundance into account
- The basis of early island biogeography
- Phylogenetic diversity
- What does it measure, and how?
- Can it be high when species diversity is low (or vice versa)?
- Functional diversity
- What does it measure, and how?
- Can it be high when species diversity is low (or vice versa)?
- How might it relate to species or phylogenetic diversity?
Species richness
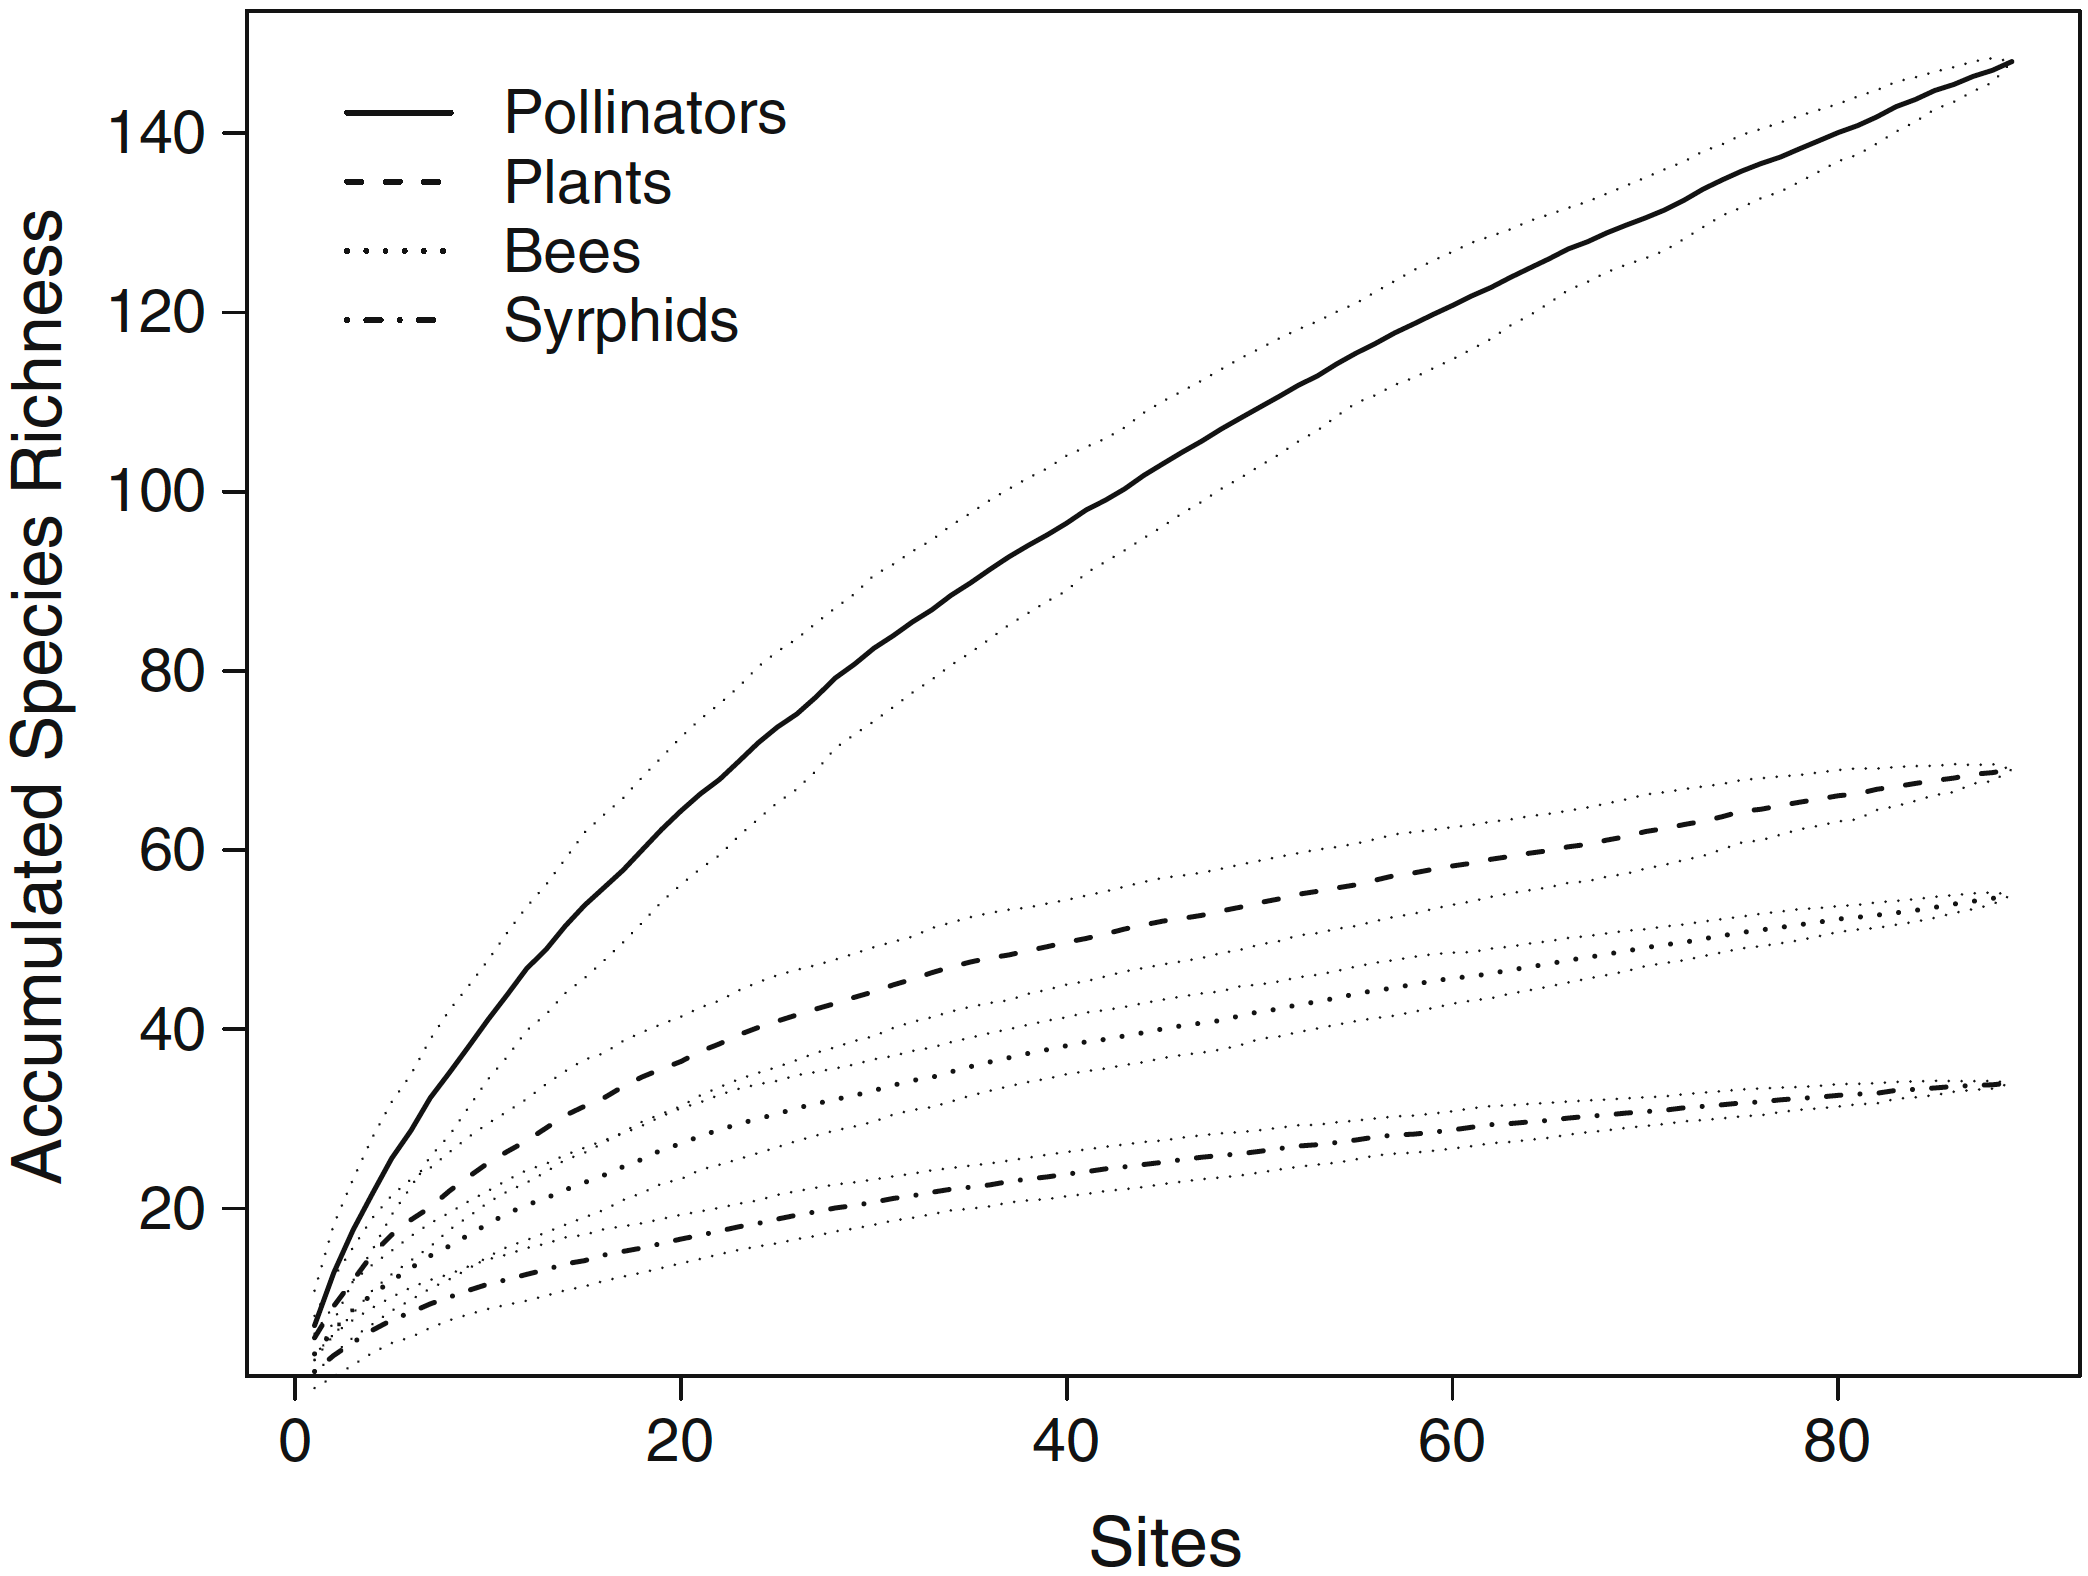
Species accumulation curves for pollinator, plant, bee and syrphid diversity with 95% confidence intervals using the method “random” in the package vegan from the statistical program R
(From: EI Hennig & J Ghazoul, 2012. Pollinating animals in the urban environment. Urban Ecosystems 15(1): 149–166 doi:10.1007/s11252-011-0202-7)
Biases among biodiversity data sets are pervasive:
- Species counts / checklists - vary by expended effort
- Sequencing results - vary likewise, by expended effort but also due to chemistry
- Occurrence data - expended effort, biases through time and space
Broad spatial patterns of species richness
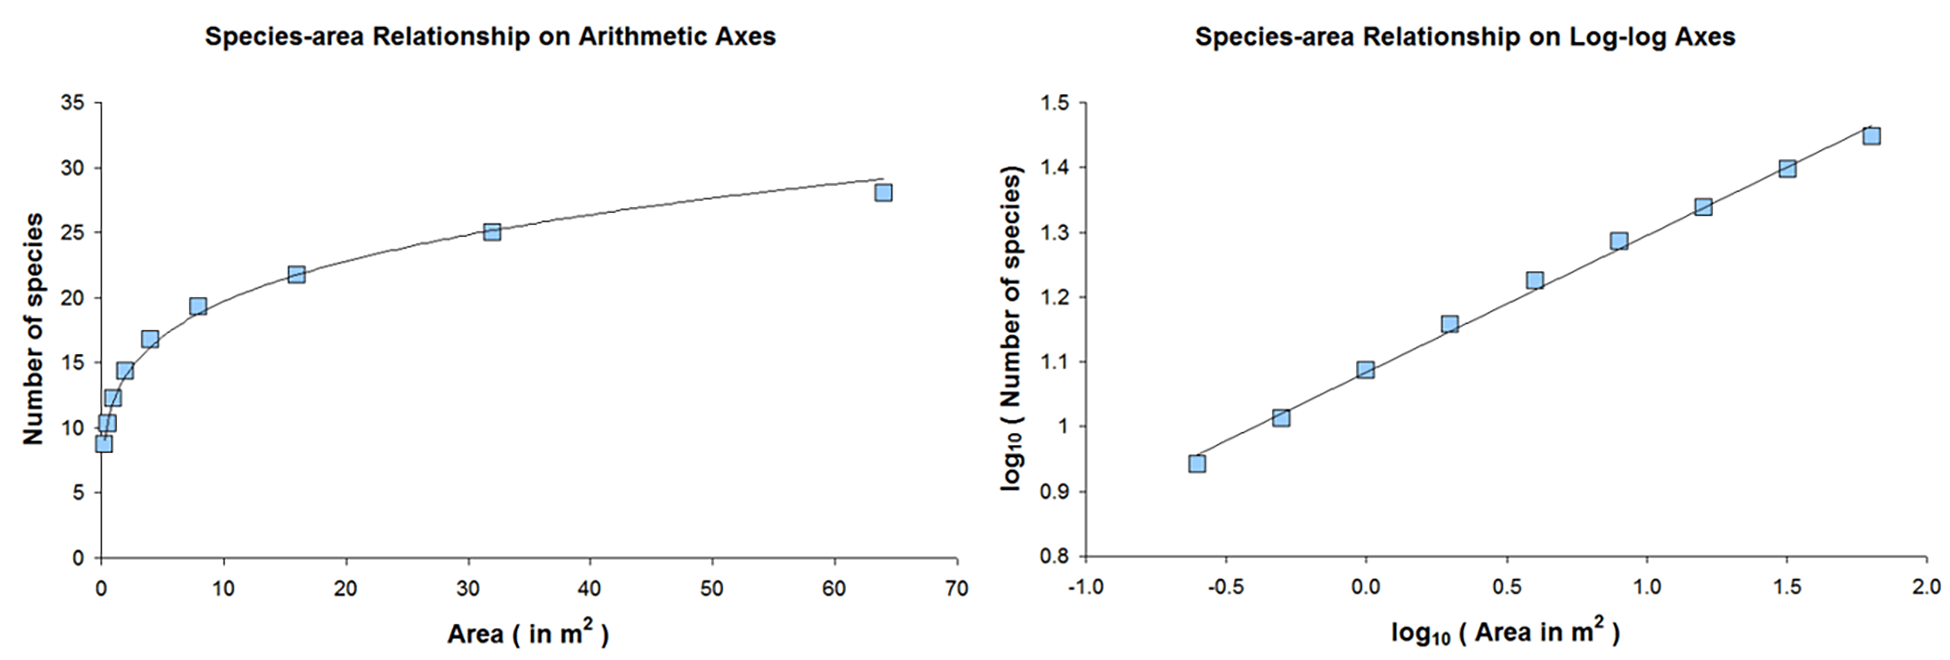
- Species-area curve - more species in larger areas
- S = CAz
- log(S) = log(C) + z * log(A)
- S = Species richness
- C = constant
- A = Area
- z = constant
Uncertainty in species-area relationships
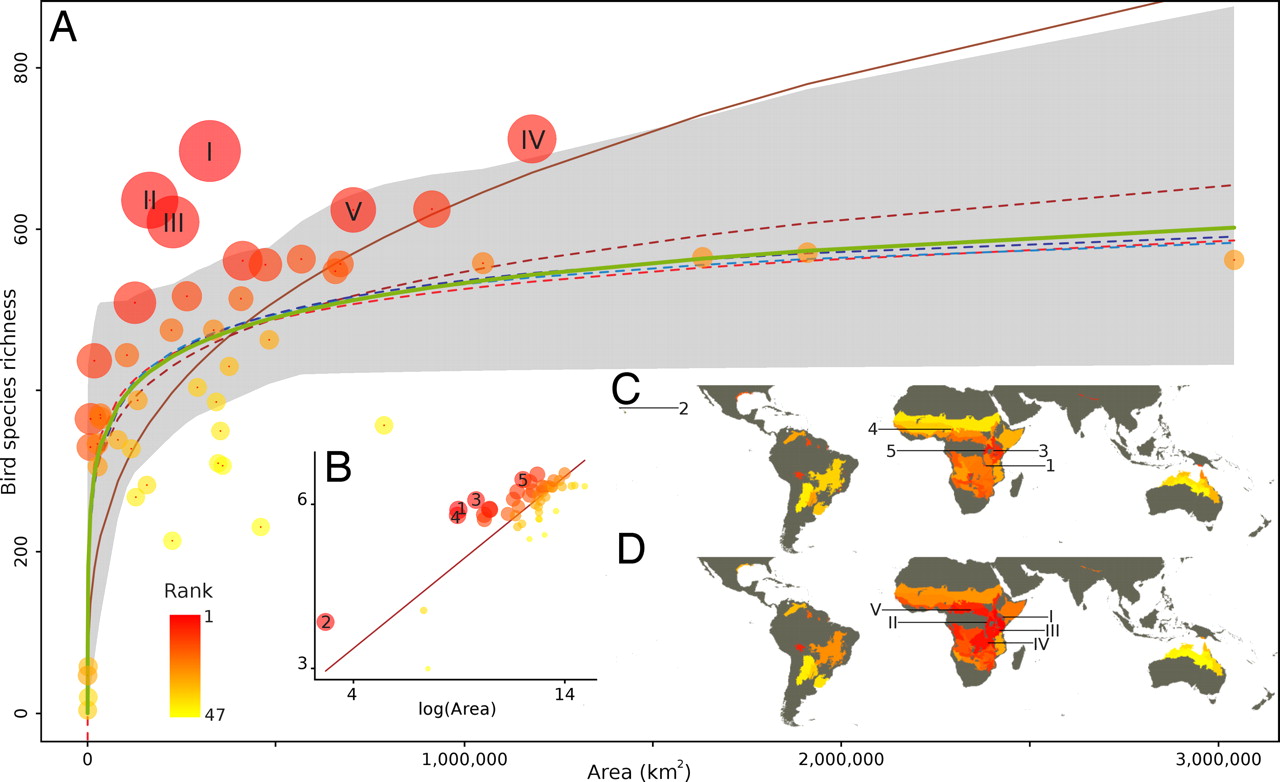
- The results revealed a high level of uncertainty in model selection across biomes and taxa, and that the power-law model is clearly the most appropriate in only a minority of cases.
- Our findings suggest that the results of analyses that assume a power-law model may be at severe odds with real ecological patterns […].
F Guilhaumon, O Gimenez, KJ Gaston, & D Mouillot, 2008. Taxonomic and regional uncertainty in species-area relationships and the identification of richness hotspots. PNAS 105(40): 15458–15463 doi:10.1073/pnas.0803610105
Incorporating relatedness and evolutionary history
- Species diversity is not very informative
- The same numbers of species might correspond with different amounts of phylogenetic diversity (PD)
- High amounts of PD seem to correspond with large amounts of biomass
- […] functional and ecological similarities are shaped by patterns of common ancestry, such that distantly related species might contribute more to production than close relatives, perhaps by increasing niche breadth.
- We show that the amount of phylogenetic diversity within communities explained significantly more variation in plant community biomass than other measures of diversity, such as the number of species or functional groups.
MW Cadotte, BJ Cardinale, & TH Oakley, 2008. Evolutionary history and the effect of biodiversity on plant productivity. PNAS 105(44): 17012–17017 doi:10.1073/pnas.0805962105
Phylogenetic diversity versus species diversity
TJ Davies & LB Buckley, 2011. Phylogenetic diversity as a window into the evolutionary and biogeographic histories of present-day richness gradients for mammals. Philos Trans R Soc Lond B Biol Sci 366: 2414–2425 doi:10.1098/rstb.2011.0058
- PD may explain some patterns better than species diversity, but it has its own dynamics as well.
- For example, South America shows low richness of old mammal lineages, with tropical lineage diversity only approaching that for Africa within the last 20 Mya.
- Probably explained by the extratropical origins of clades that subsequently diversified in South America following successive migration events and the formation of the Isthmus of Panama (±3MYA)
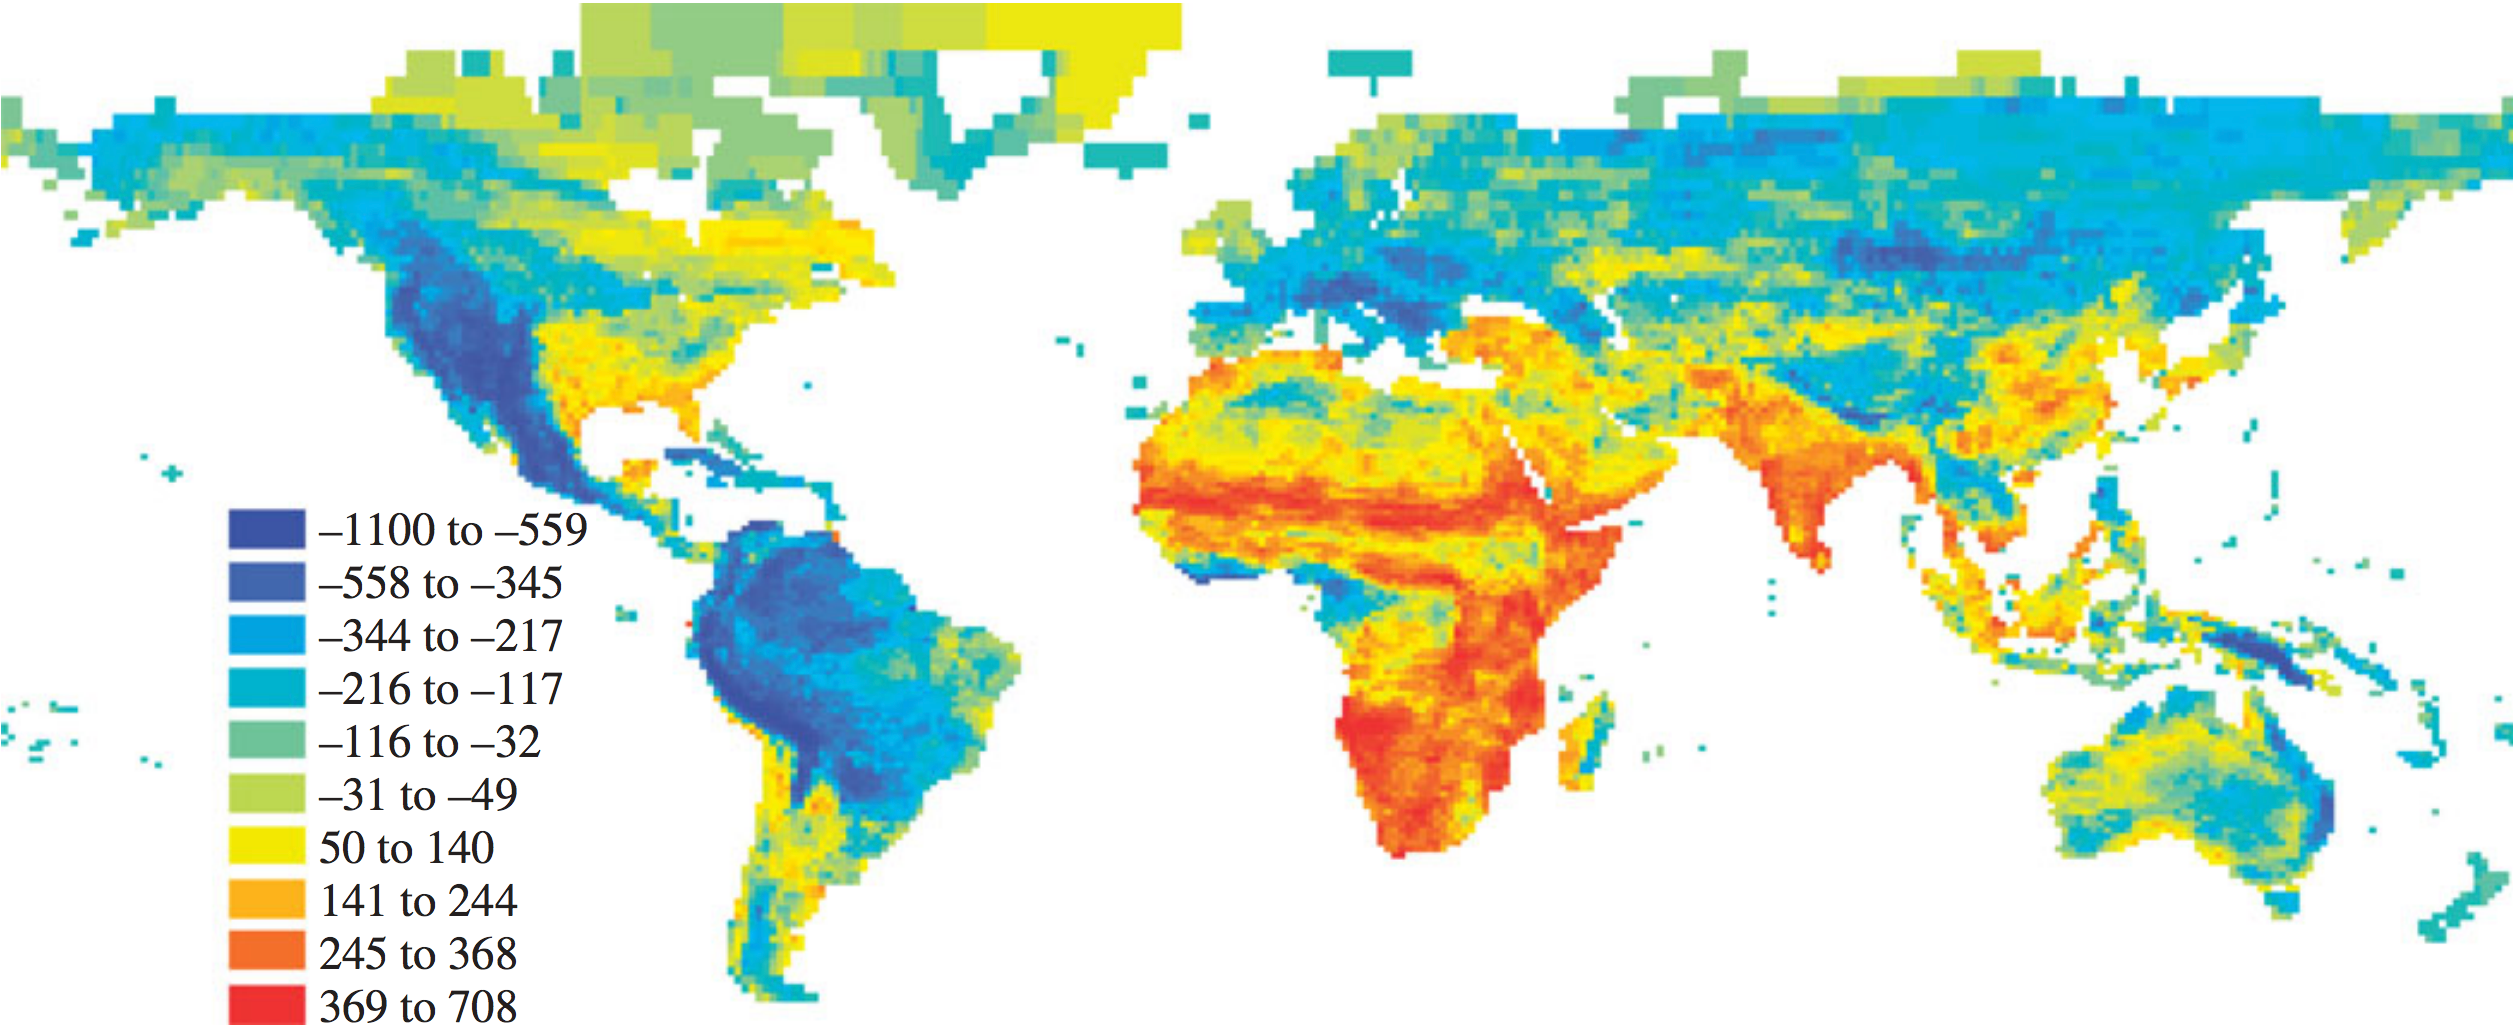
Residuals (millions of years) from a LOESS regression of cell PD against cell species number. Blue = less PD than expected, red = more than expected.
Functional diversity
OL Petchey & KJ Gaston, 2006. Functional diversity: back to basics and looking forward. Ecology Letters 9(6): 741–758 doi:10.1111/j.1461-0248.2006.00924.x
Functional diversity concerns the range of things that organisms do (mediated by their traits) in communities and ecosystems. Selecting and analyzing traits to incorporate in FD calculations is complicated:
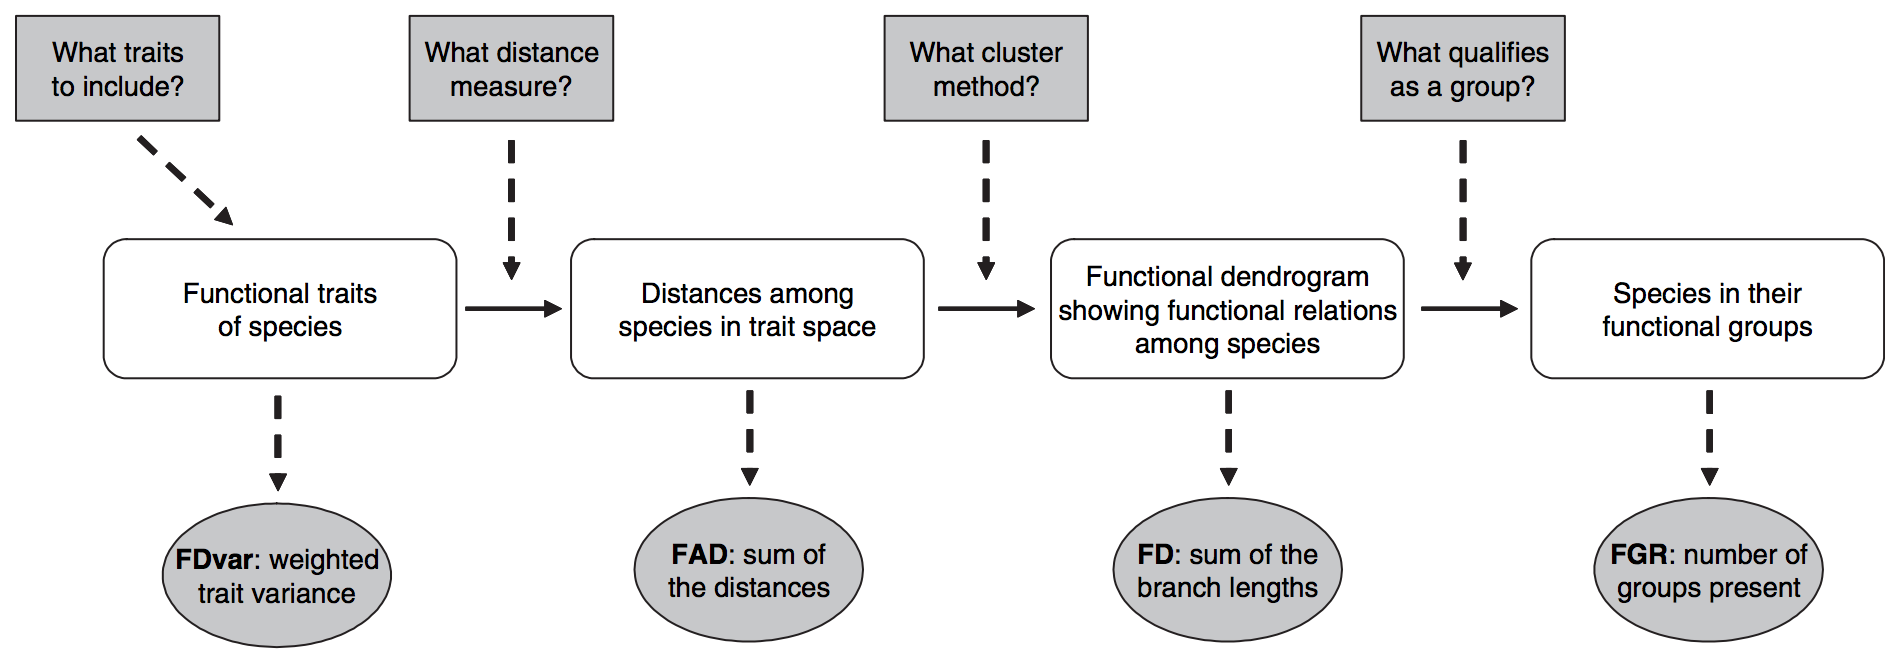
- FDvar Mason et al., 2003
- FAD Walker et al., 1999
- FD Petchey & Gaston, 2002
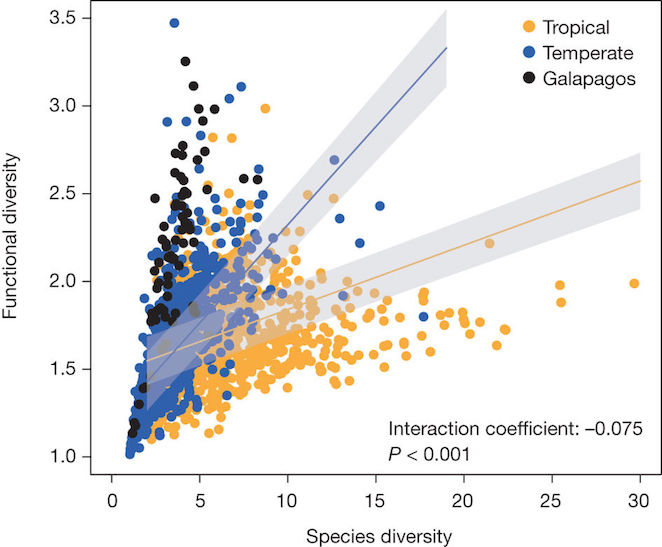
Functional diversity versus species diversity
RD Stuart-Smith et al., 2013. Integrating abundance and functional traits reveals new global hotspots of fish diversity. Nature 501: 539–542 doi:10.1038/nature12529
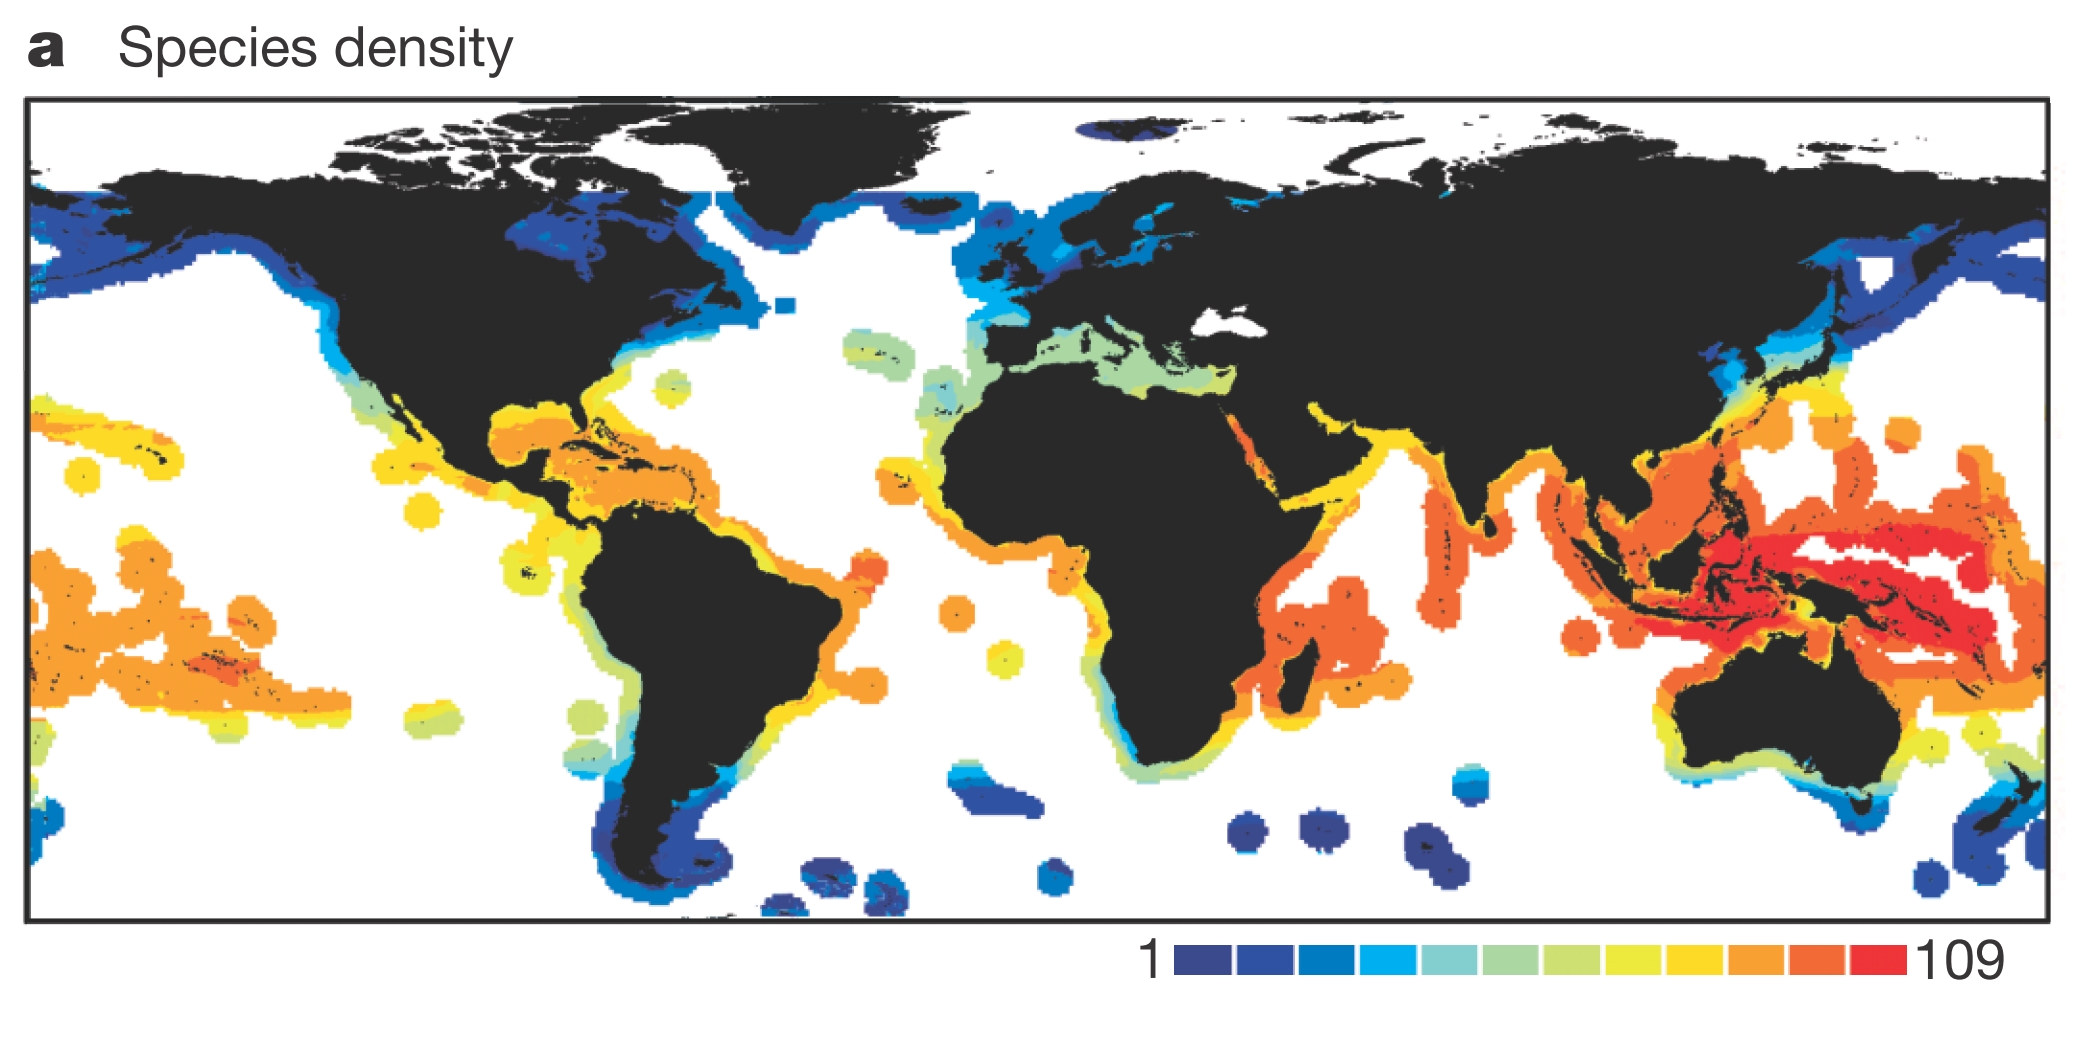
In reef fish diversity, highest diversity at the equator, and decreasing towards the poles, with highest diversity concentrated in the so-called ‘Coral Triangle.’
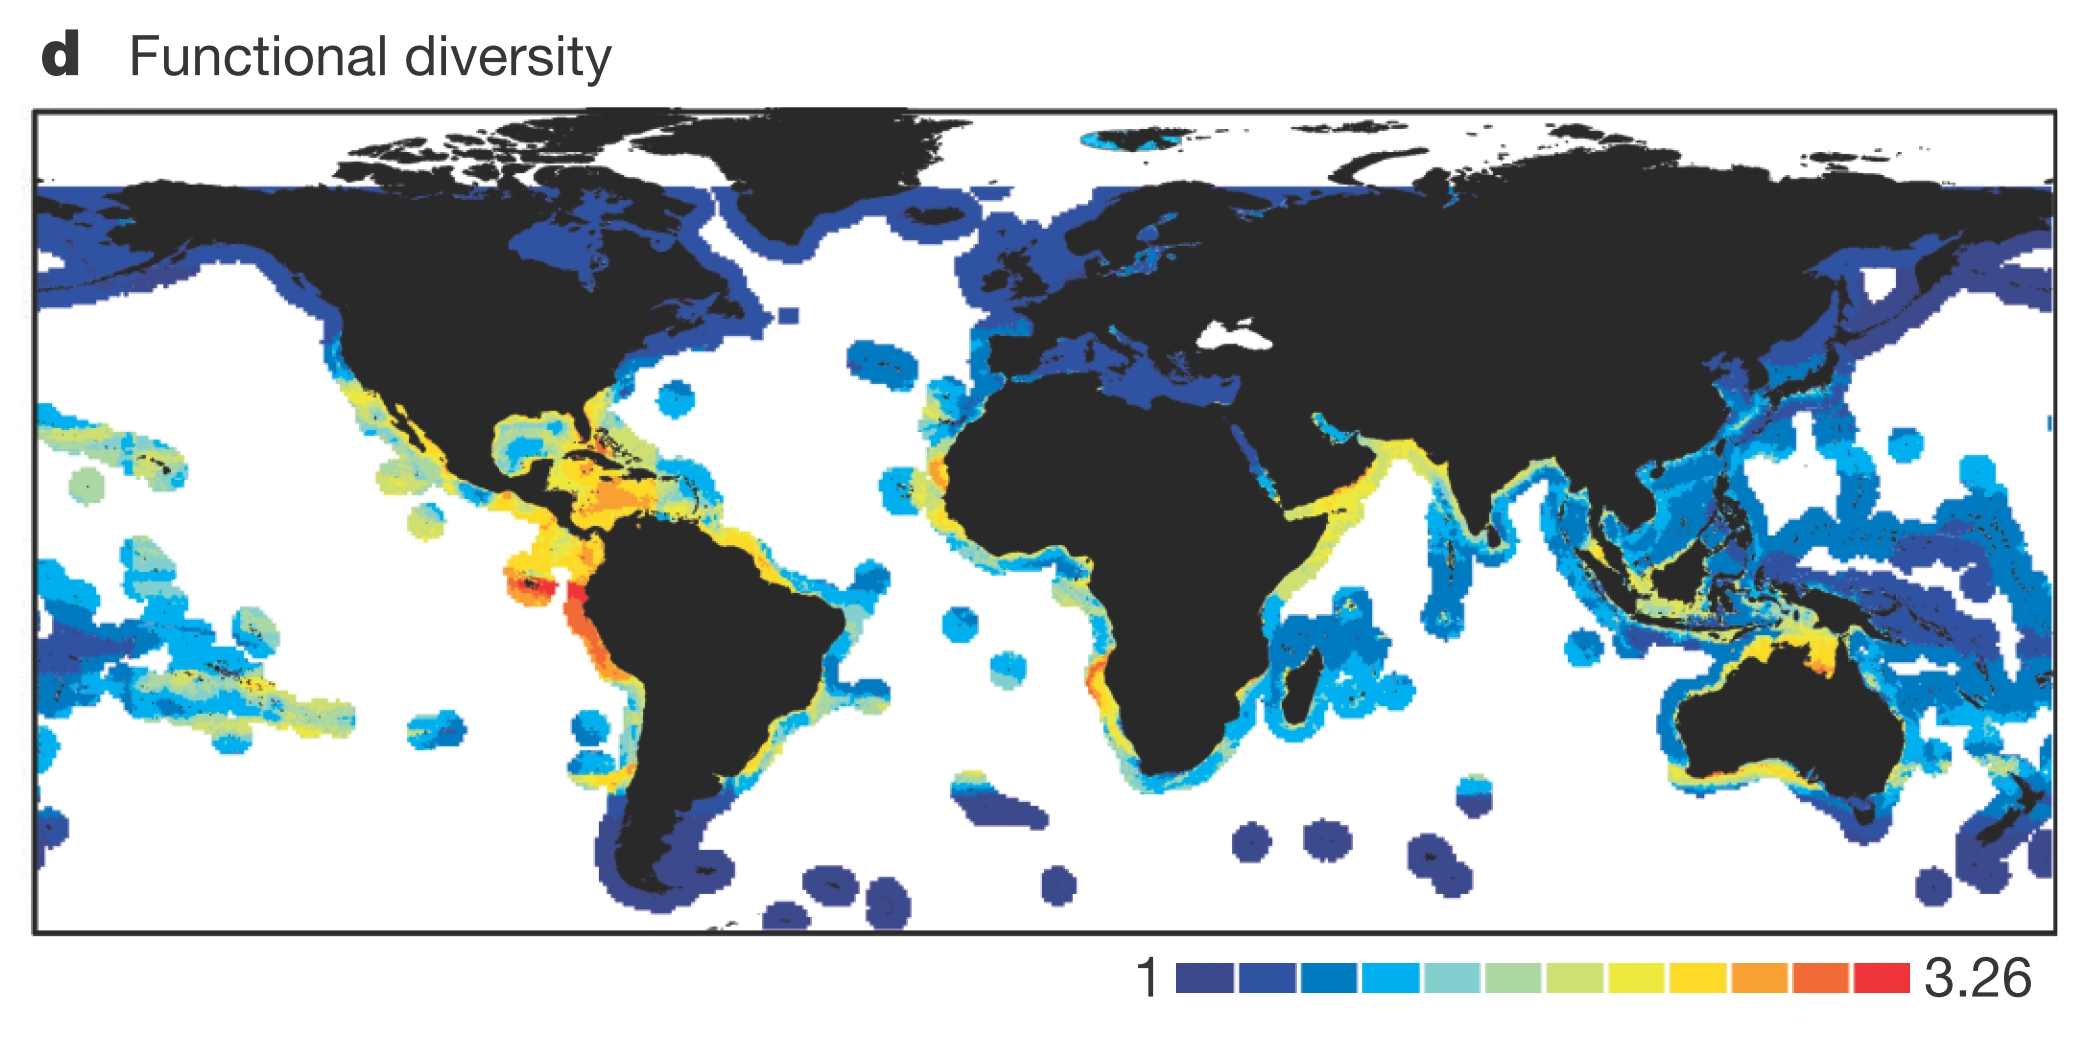
…But if we look at not just richness, but what species are doing, we find a very different pattern. This map suggests that the Coral Triangle is one of the least functionally diverse places on the planet. In other words, it harbors a lot of species, but in general, they are all doing more or less the same thing.
Broad spatial patterns of functional diversity
Source: 10.1038/nature12529
How different diversity measures interact
PL Thompson, TJ Davies & A Gonzalez, 2015. Ecosystem Functions across Trophic Levels Are Linked to Functional and Phylogenetic Diversity. PLoS ONE 10(2): e0117595 doi:10.1371/journal.pone.0117595
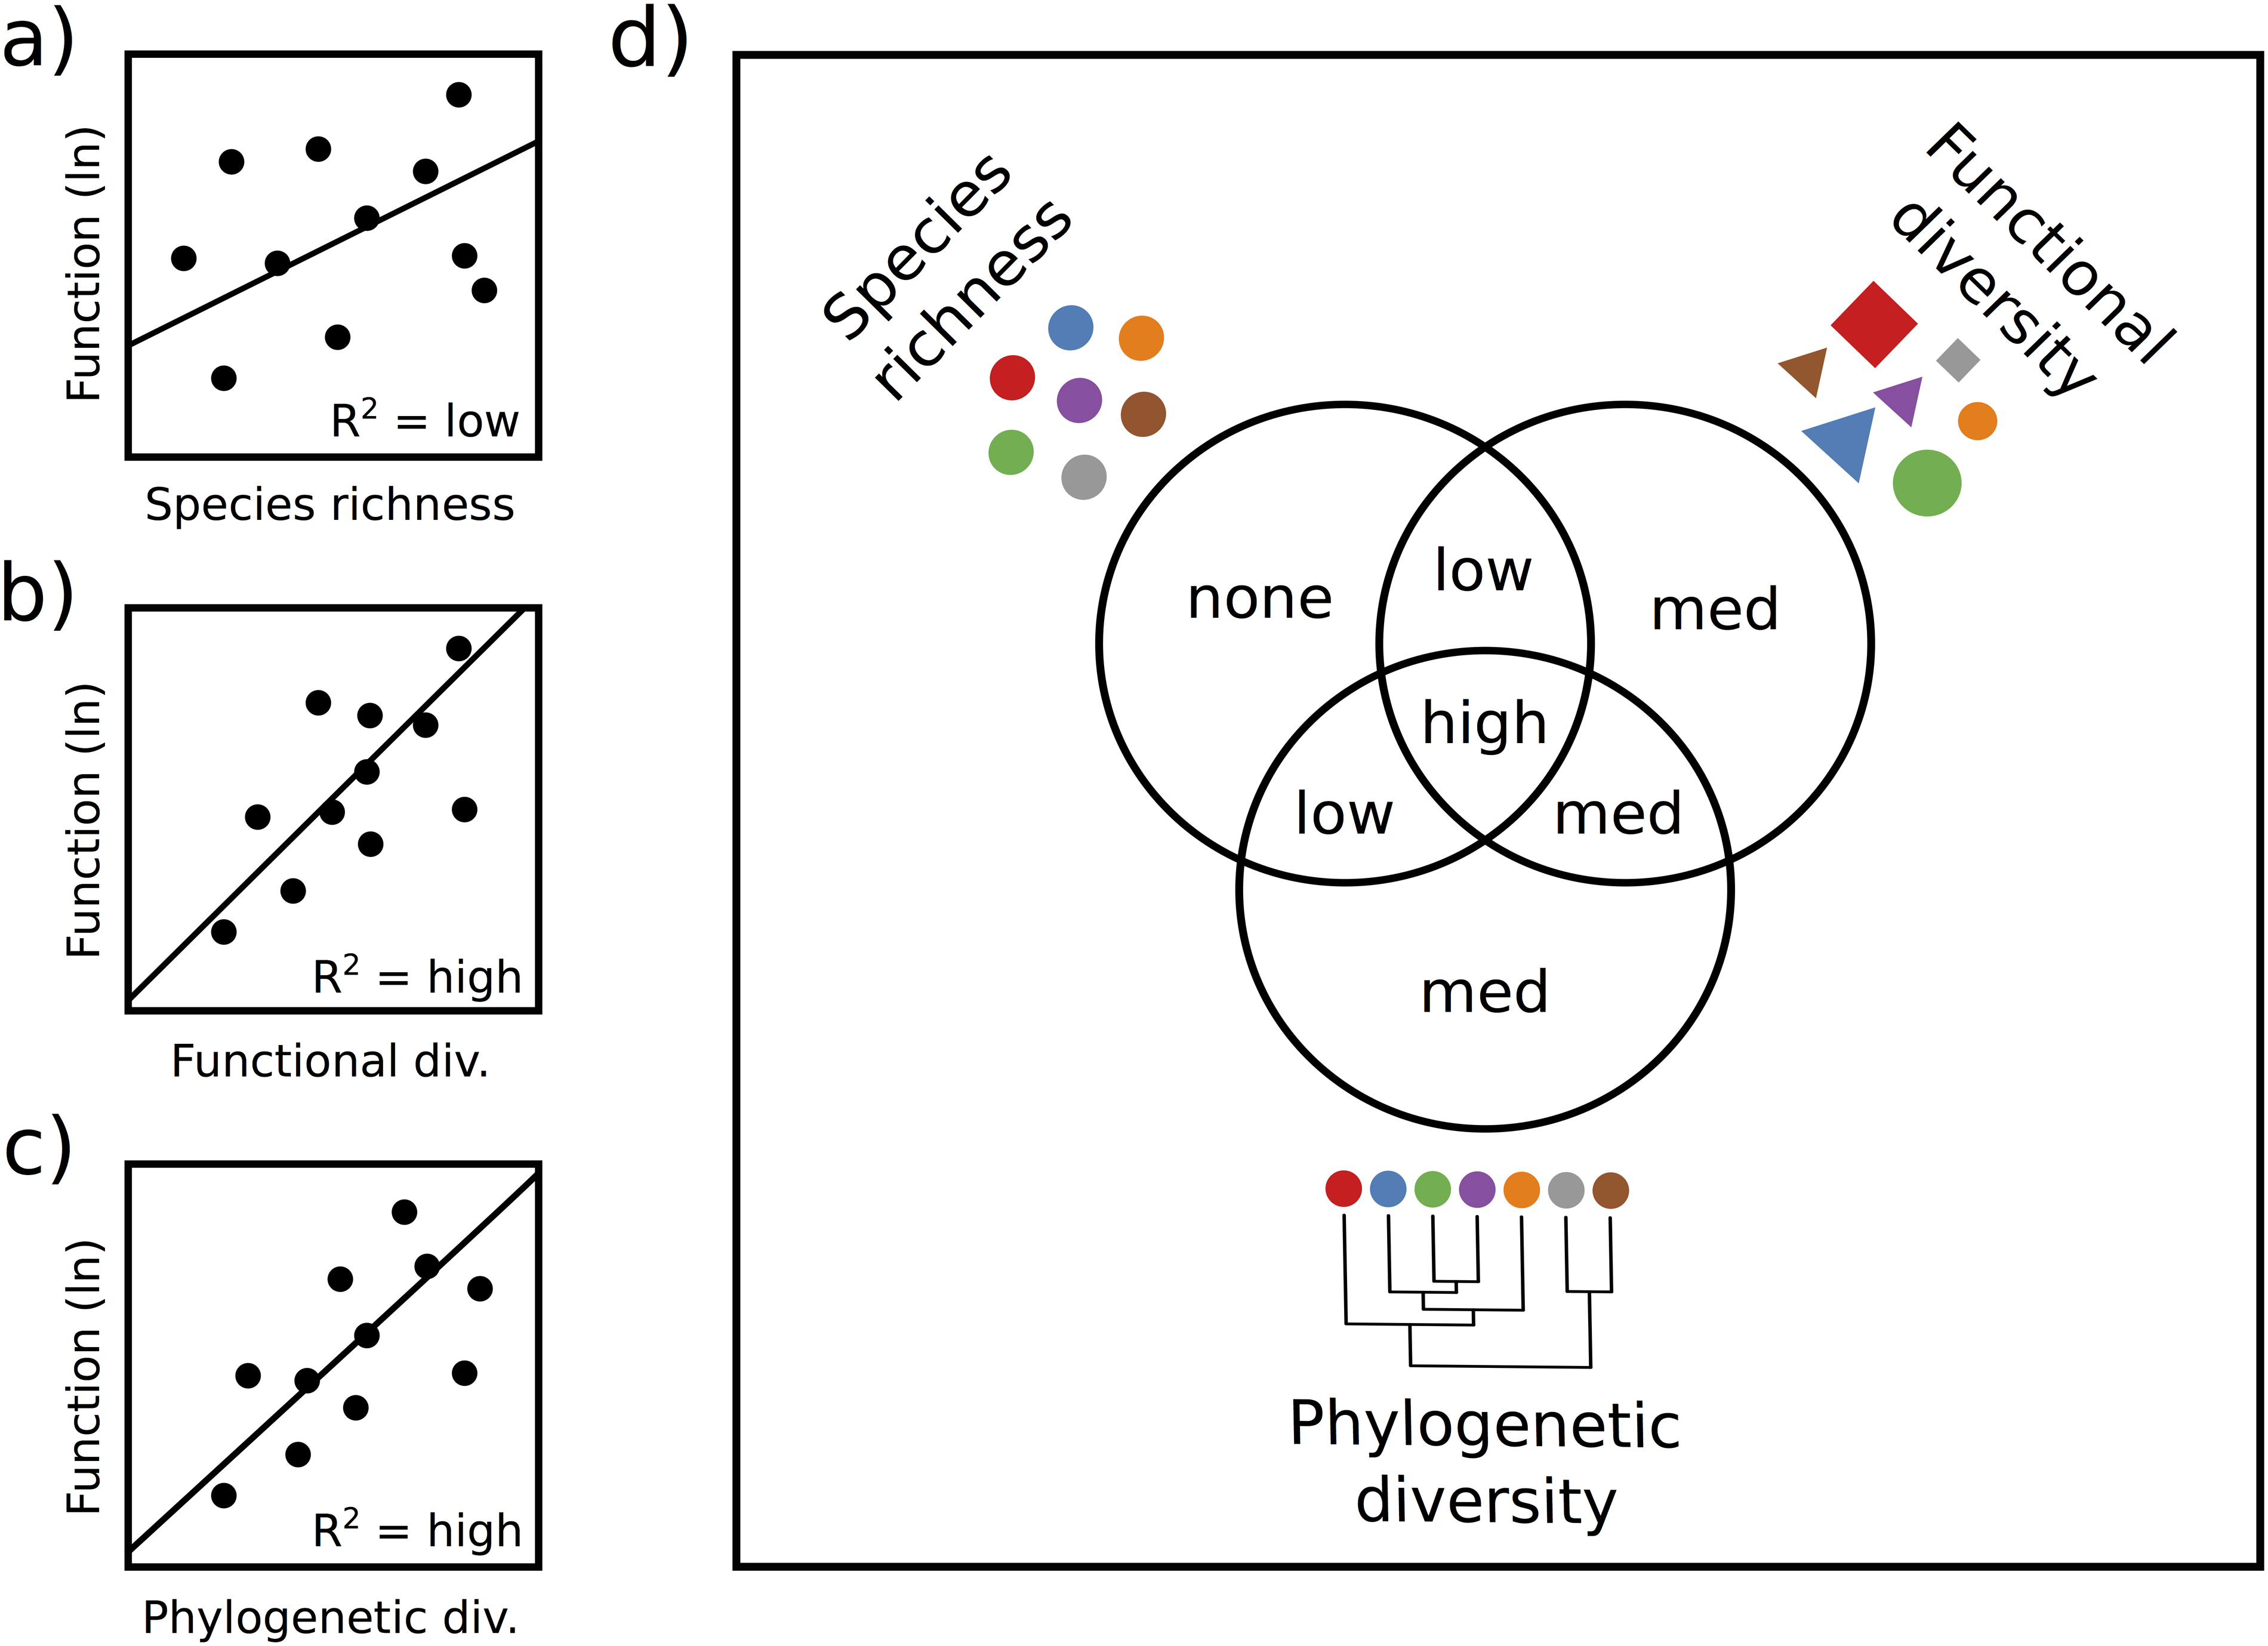
Hypothesized relationships between ecosystem function and species richness (a), functional diversity (b), and phylogenetic diversity (c).
We predict a stronger relationship with ecosystem function, and thus a higher R2, for functional diversity (b) and phylogenetic diversity (c) than for species richness (a) because the former two measures incorporate information about the traits, or the evolutionary similarity of the different species in the community. Panel (d) depicts the results of variation partitioning, indicating our hypothesis that functional and phylogenetic diversity will explain all of the variation explained by species richness, as well as additional variation, both overlapping and unique.
Dynamics of biodiversity
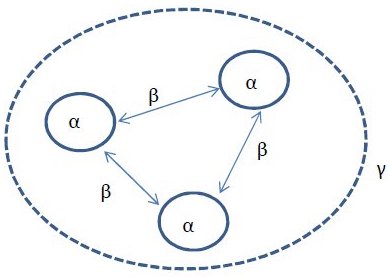
- alpha (α) diversity: within a single extent of time and space
- beta (β) diversity: the turnover between locations or time windows
- gamma (γ) diversity: the total diversity in a system
Research questions surrounding, for example, latitudinal gradients in diversity can thus be couched in terms of α, β and γ diversity.
Measuring biodiversity
- Molecular techniques, i.e. one-dimensional biomolecular sequence data, which allows us to sample species diversity and phylogenetic diversity (week 1)
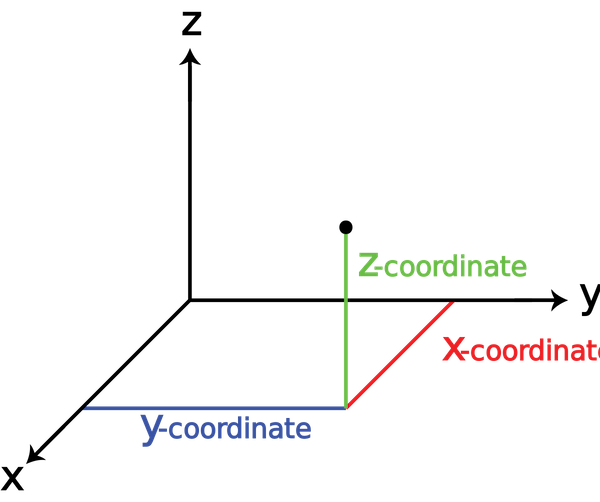
- Occurrences, i.e. two-dimensional (lat/lon) coordinate data, combined with climate, land use, remote sensing, etc., to identify spatial patterns (week 2)
- Trait/character measurements, i.e. multidimensional data, to explore functional diversity (week 3)
Biodiversity data
- Many different types
- At different scales: molecules to ecosystems
- High dimensionality
- High volume
- An explosion of digital sensors:
- HTS DNA sequencers
- Remote sensing satellites and drones
- Digital cameras
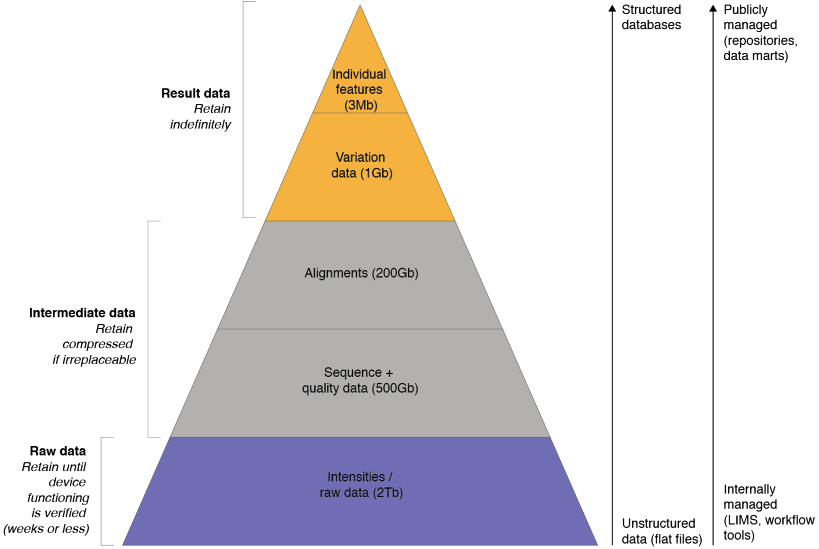
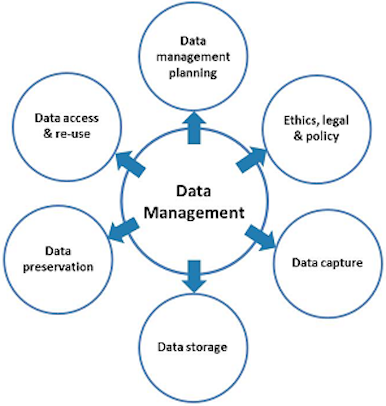
The “data life cycle”
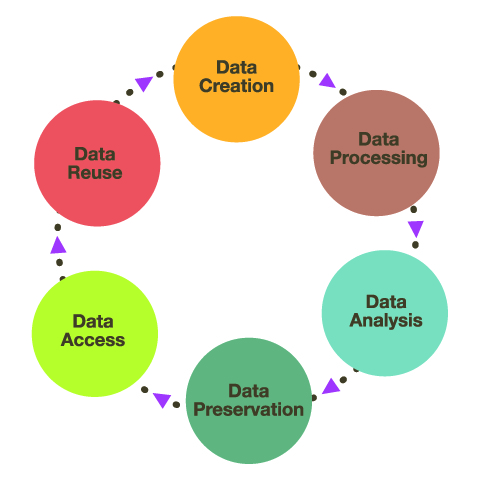
Biodiversity data, like all research data, needs to be managed properly throughout the data life cycle:
- Data creation - e.g. in a lab when a sequencing assay is run
- Data processing - any quality filtering, dimensionality reduction
- Data analysis - all substantial calculations and hypothesis tests
- Data preservation - store data and metadata for perpetuity
- Data access - allow stored data to be accessed, considering interoperability
- Data reuse - stand on the shoulders of others
“Data science”
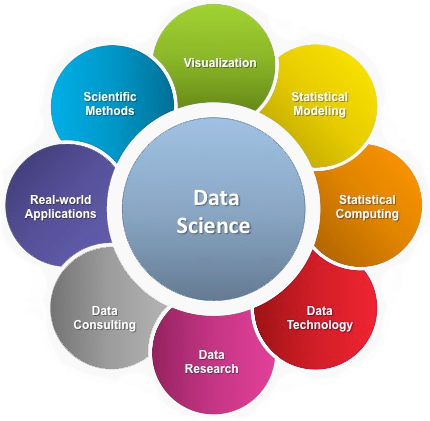
Data science is concerned with the dirty work throughout the data cycle:
- Representation and modeling of collected data, e.g. how to represent sequence data and metadata in efficient ways
- Data processing: cleaning, for example removing low quality observations, filtering data to observations of interest, reduction, integration
- Data management: technological issues surrounding metadata, versioning, interoperability, preservation and access
- Handling scalability: technological challenges and solutions, e.g. automation
- And finally: analyzing, visualizing, and interpreting data
Representation and modeling of collected data
- How is sequencing data represented over the course of the data cycle, what does it capture, how is it annotated with additional information?
- How is geospatial data represented? There are different data types (e.g. number types, pixel values), different scaling levels, different coordinate systems, etc.
- How is graph-like data represented? For example, how to traverse very large trees or networks?
- How to represent idiosyncratic traits and characters?
Data processing
- To go from raw data capture to useable data, a lot of cleaning, filtering, format conversion, and reduction (volume and dimensionality) needs to take place.
- To make data that is useable to you also useful to others, data integration techniques need to be considered. For example, how to combine your molecular sequences (and phylogenies) with occurrences and traits from public databases?
Methods in biodiversity data analysis
Biomolecular sequences
- Sequence clustering and species delimitation
- De novo and mapping assembly, annotation, and variant calling
- Phylogenetic analysis, tree shape analysis, molecular selection analysis
Geospatial data
- GIS operations
- Ecological niche modeling
- Projections
Traits and characters
- Comparative analysis
- Functional diversity
- Trait-dependent diversification
Data management
- How to manage versions of data, their history, and provenance?
- How to store and share data?
- How to represent, store, and share what we know about the data?
Analysis workflows
- Too much data to do ‘by hand’
- Reproducibility is easier with automation
- We will explore this using the UNIX/Linux shell, using R, and scripting languages (a bit of Python and Perl)
Tools of the trade