mebioda
Case studies of genome sequencing in biodiversity research
Genetic diversity: tomato relatives
Aflitos et al., 2014. Exploring genetic variation in the tomato (Solanum section Lycopersicon) clade by whole-genome sequencing The Plant Journal 80(1): 136–148 doi:10.1111/tpj.12616
- 84 accessions, 2.9 × 10¹² base pairs sequenced
- coverage of 36.7 ± 2.3-fold per accession (32.5 ± 2.1-fold for Phred (Q) ≥ 30)
- paired end sequencing (Illumina HiSeq 2000, read length 100 bp) with insert size 500 bp
- 4 accessions additional mate pair sequencing (Illumina and 454) with larger insert sizes

This project includes the sequencing of ancient herbarium specimens from the Naturalis collection.
De novo assembly
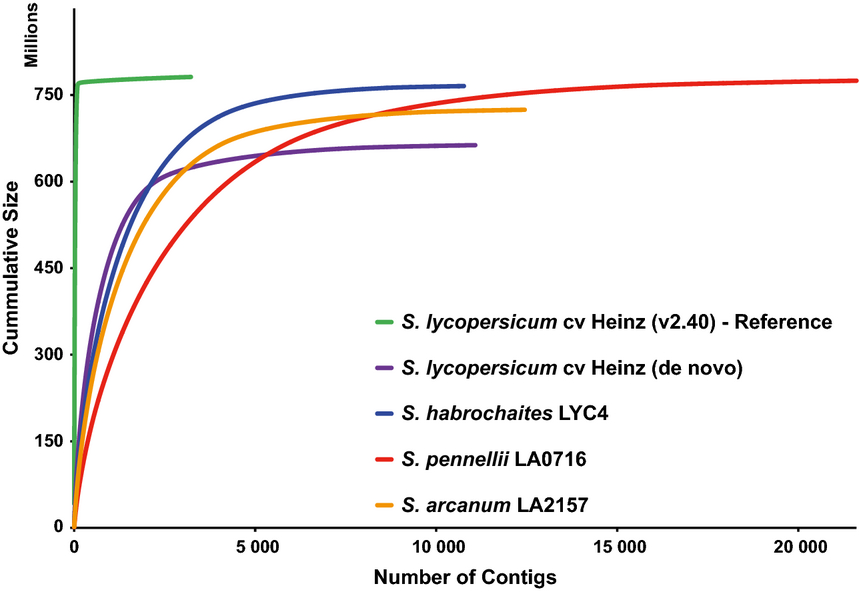
- 3 genomes of species in Solanum section Lycopersicon assembled de novo with AllPaths-LG
- 1 genome both with CLC and AllPaths-LG (to compare)
- contigs from AllPaths-LG were then scaffolded using the 454 data and the scarpa scaffolder
Mapping to multiple reference genomes
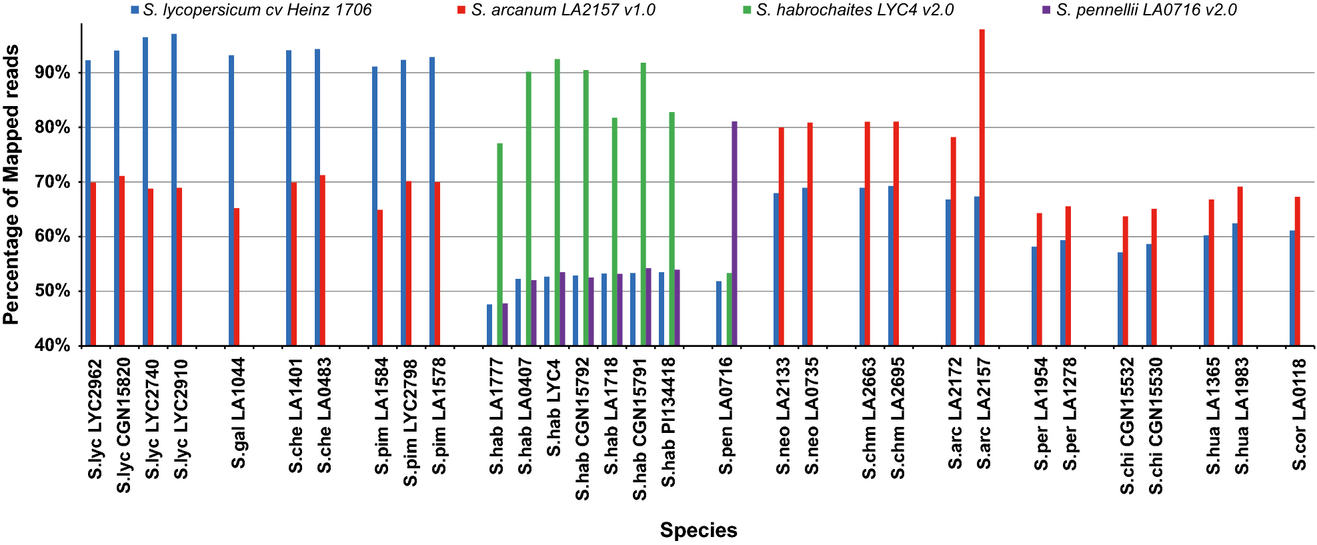
- reads were mapped against assemblies of S. lycopersicum, S. arcanum, S. habrochaites and S. pennellii and against the reference SL2.40 of S. lycopersicum cv. Heinz
- the shifts in the percentages of reads mapped depending on the reference indicates an abundance of genetic diversity outside of S. lycopersicum cultivars
- mapping assemblies were done using the Burrows-Wheeler Aligner BWA
Variant calling
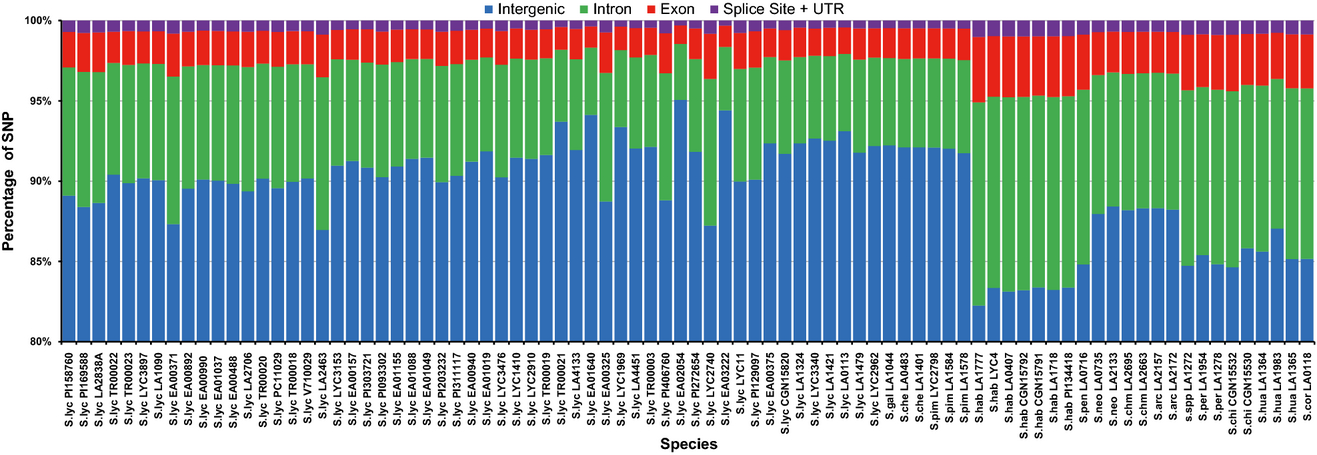
- variants (SNPs) were called using samtools
- location (intergenic, intro, exon, splicing sites and UTRs) was determined with reference to the ITAG3.0
- 89.47 ± 3.03% of the polymorphisms fall into intergenic regions
- 7.55 ± 2.19% map to introns
- 2.33 ± 0.68% map to exons, of which:
- 55.17 ± 11.54% are synonymous
- 44.83 ± 21.03% are non-synonymous
Phylogenetic relationships
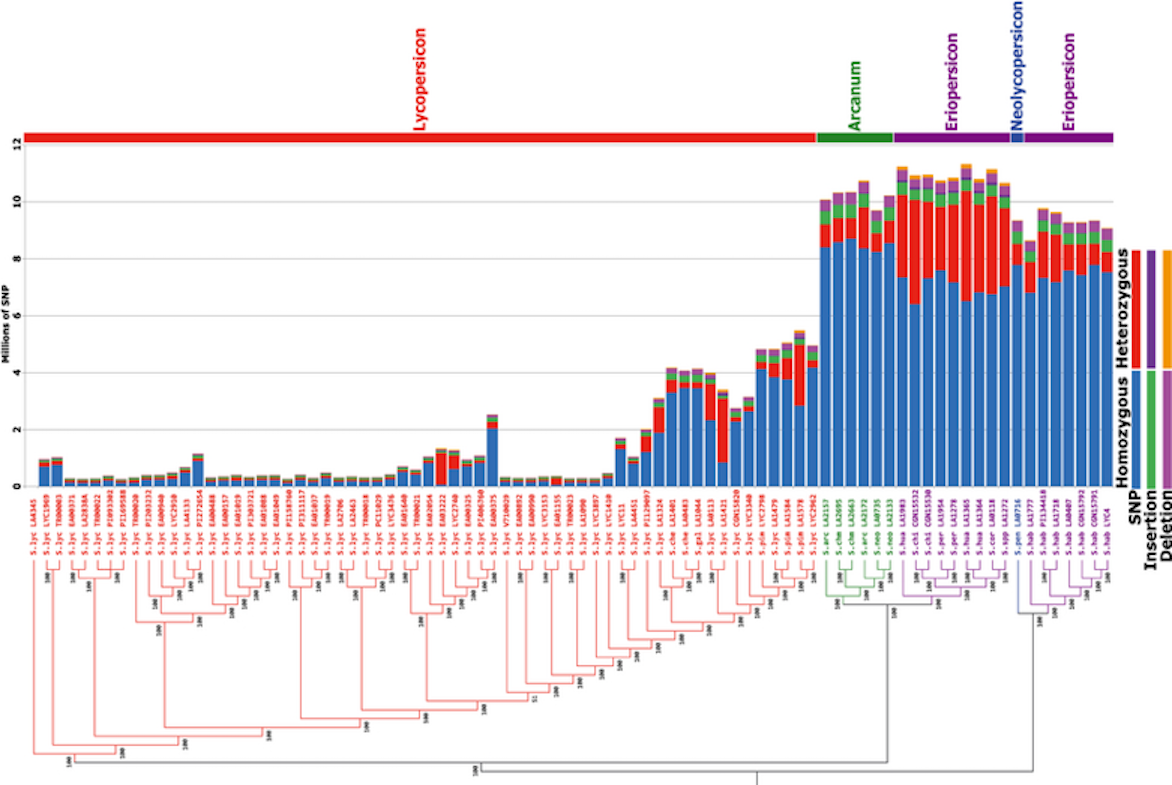
- SNPs with Q > 20 were concatenated and analyzed using FastTree
- bootstrapped NJ under the Jukes & Cantor (1969) substitution model
- SNP numbers for Arcanum, Eriopersicon and Neolycopersicon groups increase sharply, which correlates with their more distant position in the phylogenetic tree in the tomato clade
Functional diversity: snake venom
Vonk, FJ et al., 2013. The king cobra genome reveals dynamic gene evolution and adaptation in the snake venom system. PNAS 110(51): 20651–20656 doi:10.1073/pnas.1314702110
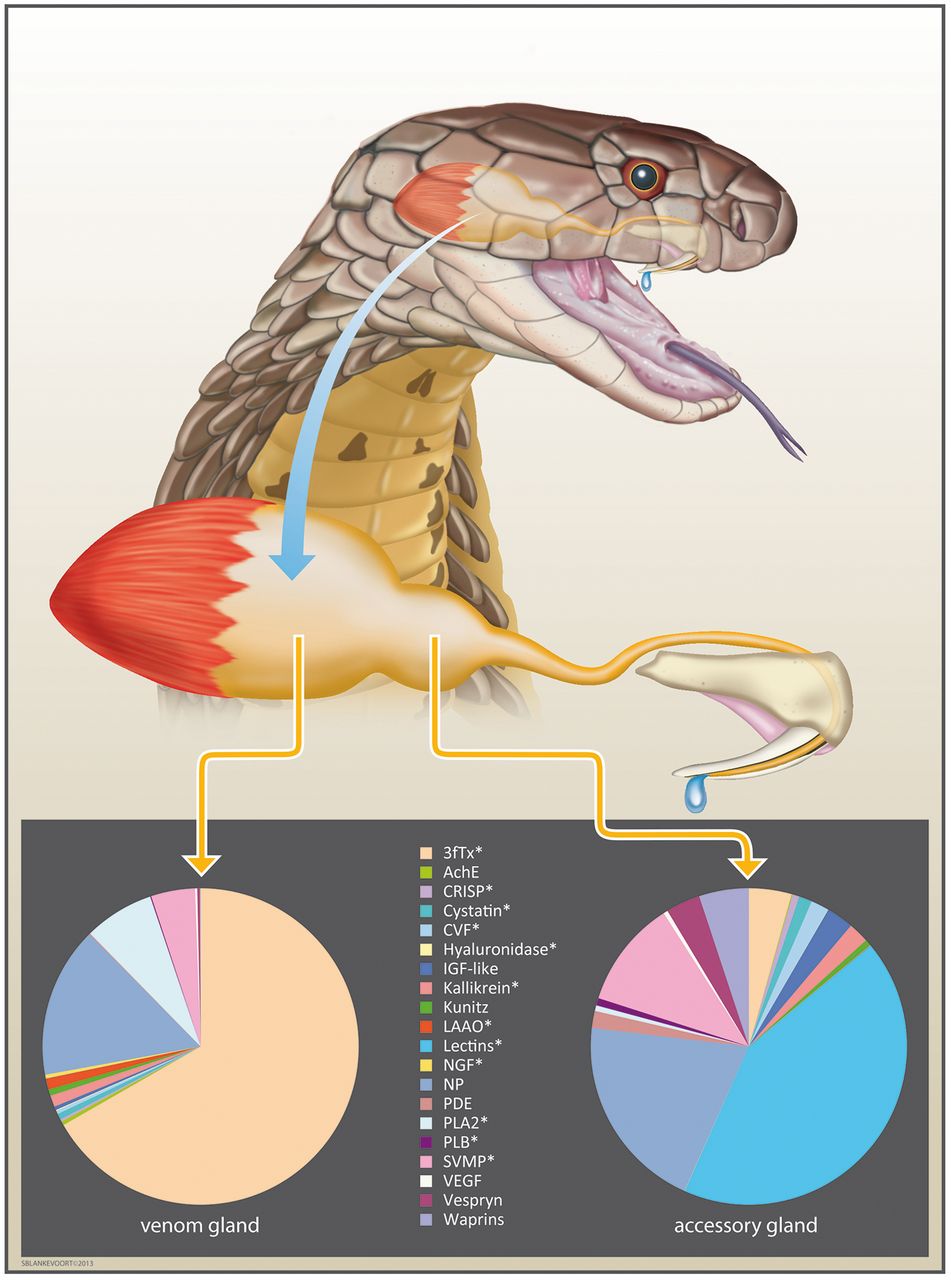
The king cobra venom system with venom and accessory gland expression profiles. Pie charts display the normalized percentage abundance of toxin transcripts recovered from each tissue transcriptome. Three-finger toxins are the most abundant toxin family in the venom gland (66.73% of all toxin transcripts and 4.37% in the accessory gland)
Sequencing and assembling the King Cobra genome
- paired end (insert size: 200-500 bp) and mate pair (insert size: 2-5 Kbp) sequencing (Illumina GAIIx, read length 36–151 bp)
- data processing including adaptor clipping
- de novo assembly using CLC, resulting in N50=3,982 bp
- scaffolding using SSPACE, resulting in an N50=225,511 bp
Venom gene analysis

- the genome was annotated using MAKER, using protein data from Uniprot/Swiss-Prot and the annotated genome of Anolis carolinensis (brief side note: the work on Caribbean Anoles by the Losos lab)
- on the basis of the MAKER genes and by BLAST searching the genome using known venom query sequences, gene copies were collected and aligned with MUSCLE
- trees were constructed with MrBayes v3.2 (for support values) and PHYML (for bifurcating point estimates)
- MP reconstruction of transitions between venomous and non-venomous orthologs and paralogs allowed branches on the PHYML tree to be assigned to venomous or non-venomous in the estimation of branch-specific dN/dS ratios (ωvenomous and ωnonvenomous) using codeml
Venom gene duplication
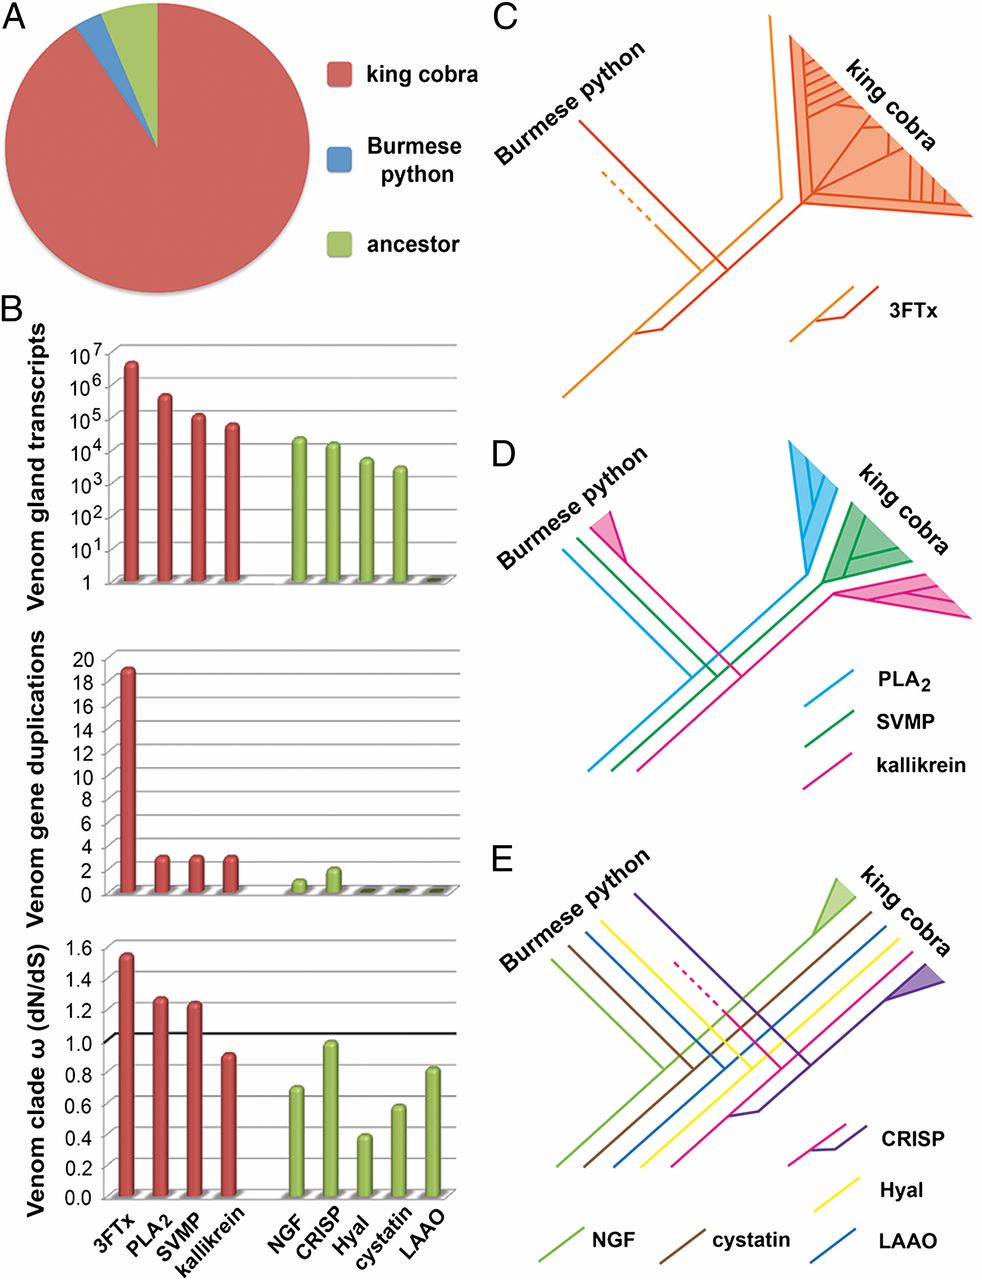
- A The vast majority of toxin family gene duplication events occurred in the king cobra lineage compared with the Burmese python and their common ancestor
- B Comparisons of venom gland expression (log-transformed), venom-related gene duplication events, and rate of evolution of main toxin families (red) and ancillary toxin families (green). ω represents the dN/dS ratio identified for venomous gene clades. The boundary for directional selection is indicated by a bold line.
- C Massive expansion of the three-finger toxin gene family
- D Moderate expansion of other pathogenic toxin families
- E Ancillary toxin families show reduced evidence of gene duplication
Gene duplication coupled with positive selection is the mechanism underlying venom protein neofunctionalization. Our results are, therefore, consistent with a prominent role for prey-driven natural selection in generating the genetic diversity of the most pathogenic toxin families.
An invasive plant among native insect herbivores
Schilthuizen M et al. 2016. Incorporation of an invasive plant into a native insect herbivore food web. PeerJ 4:e1954 doi:10.7717/peerj.1954
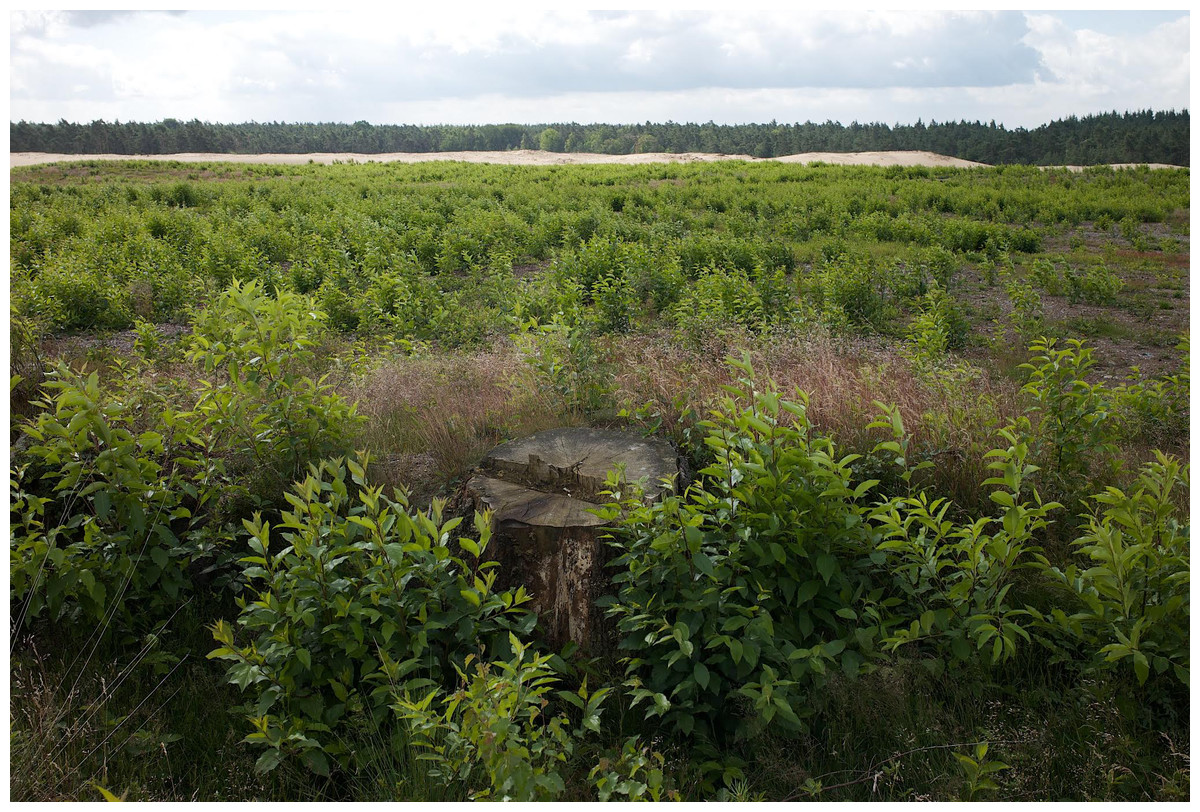
In open habitats, such as this moorland in the Netherlands, the exotic Prunus serotina (black cherry) may spread invasively, as this carpet of seedlings shows. Understanding how phytophagous insects colonize such invasives is therefore of scientific as well as practical interest.
Herbivores switch to the new invasive
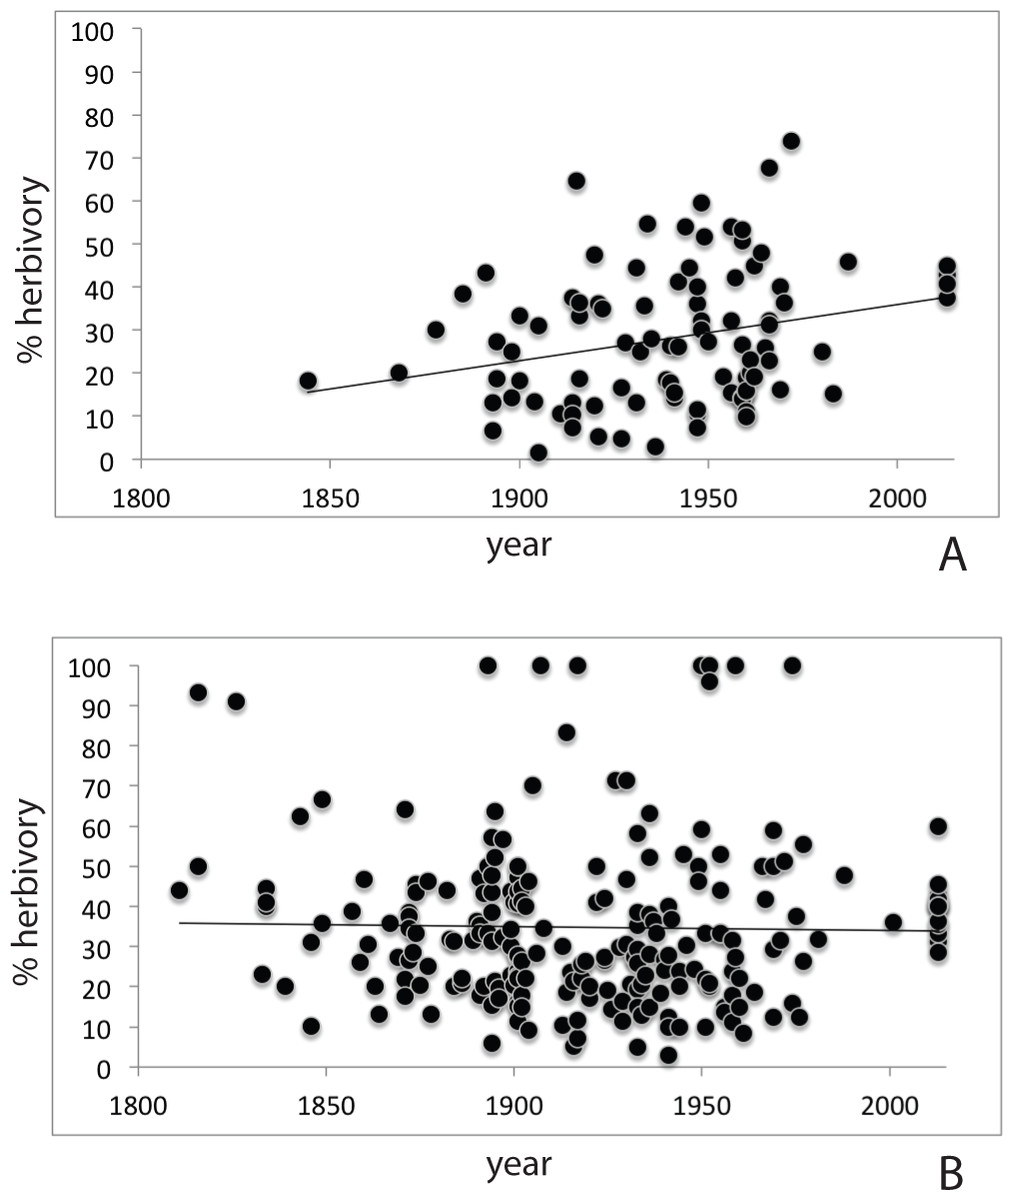
- Assessment of herbarium specimens through time shows increasing herbivory on the new invasive (A) compared to the native P. padus (B)
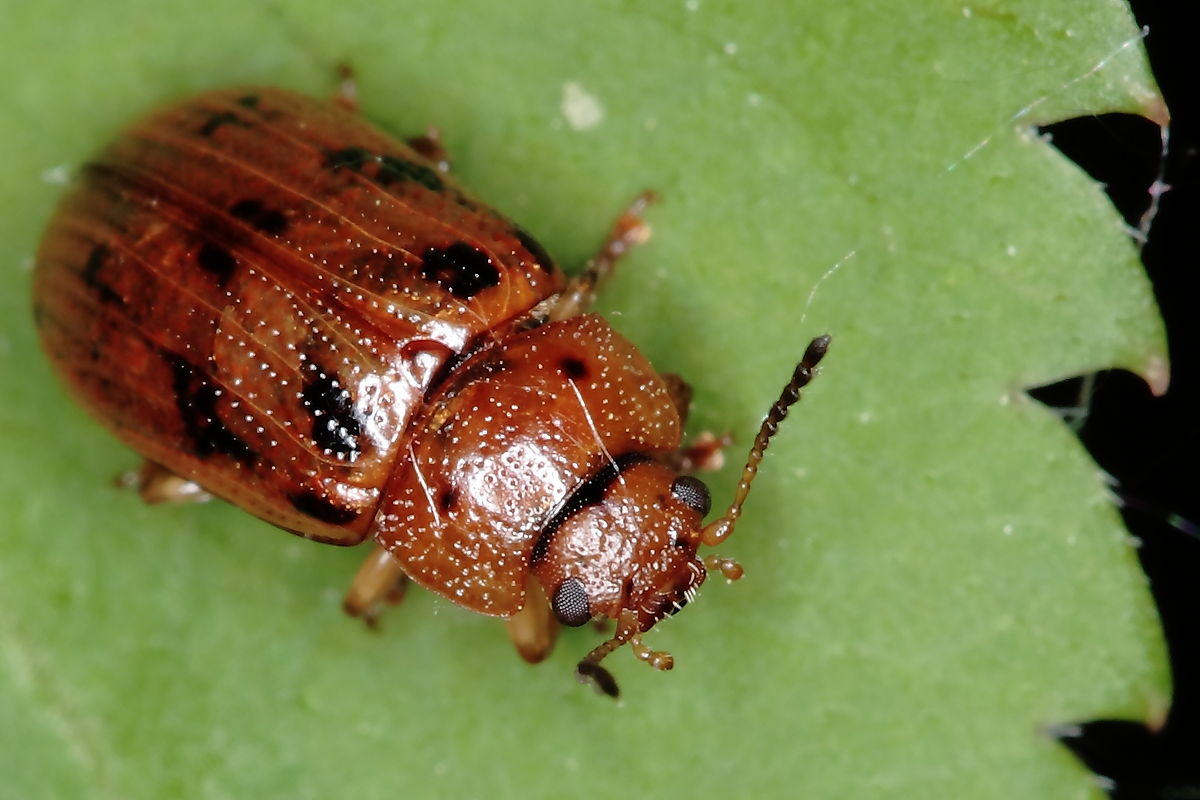
- G. quinquepunctata is a model specialist, originally found only on Sorbus aucuparia, but recently also observed on P. serotina
- host choice experiments on collected beetles showed that individuals from Sorbus preferred Sorbus, while those from Prunus showed no significant preference
Sequencing G. quinquepunctata
- 2 individuals (one from each host) were paired-end sequenced (Illumina HiSeq 2000)
- reads from the individuals were pooled to create a pseudo-reference, assembled with ABySS, (k-mer length=23, obtained with KmerGenie)
- reads from the two individuals were then mapped back against the pseudo-reference using BWA
SNP calling and selection
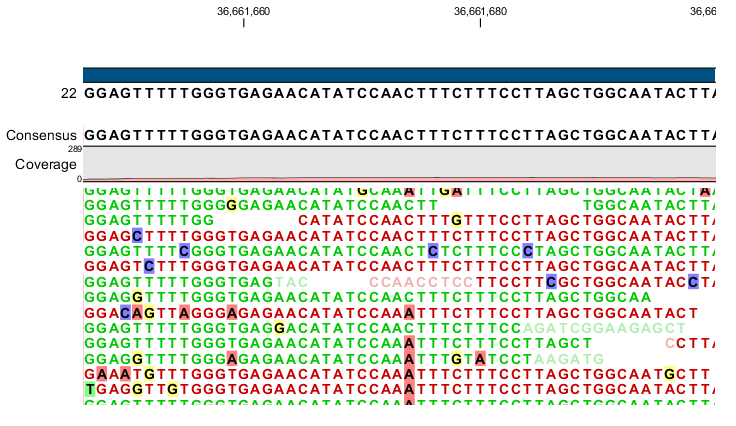
- SNPs were called using samtools according to
the following criteria:
- the positions were both homozygous for different alleles between the samples
- had a coverage of at least 10×in each sample
- had flanking regions that were at least 100 bp long with a minimum combined coverage of at least 15x with a maximum of 2 heterozygous positions
- contigs containing candidate SNPs were validated by BLAST and removing all non-arthropod contigs
Genotyping host populations
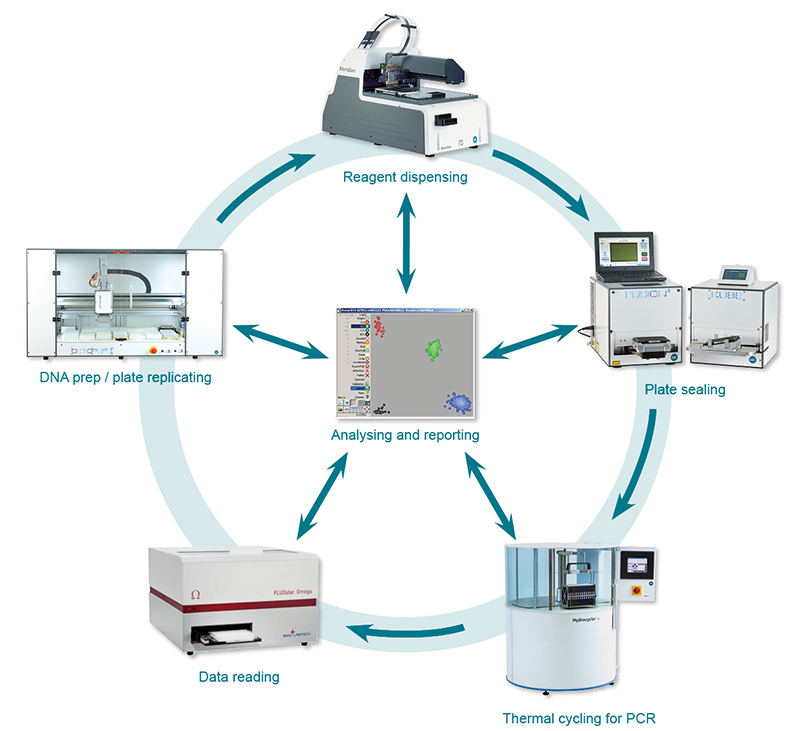
- for a random sample (n=128) of the filtered SNPs, primers were designed using kraken
- an additional 206 beetles from S. aucuparia, and 173 from P. serotina were collected and genotyped with the LGC SNPline
Analysis of Molecular Variance
- SNPs were analyzed using Analysis of Molecular Variance (AMOVA), which is implemented in Arlequin and the R package ade4
- The AMOVA produces estimates of variance components and F-statistic analogs, reflecting the correlation of haplotypic diversity at different levels of hierarchical subdivision (in this case, of host plants nested within sampling localities).
- The hierarchical AMOVA with host plants nested within localities, showed significant (P < 0.01) differentiation between host plants in each locality
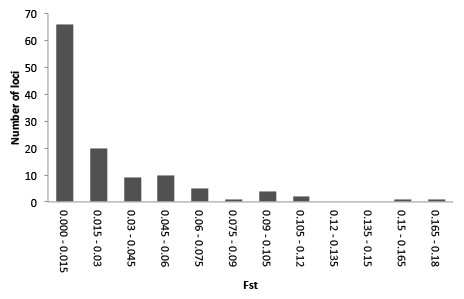
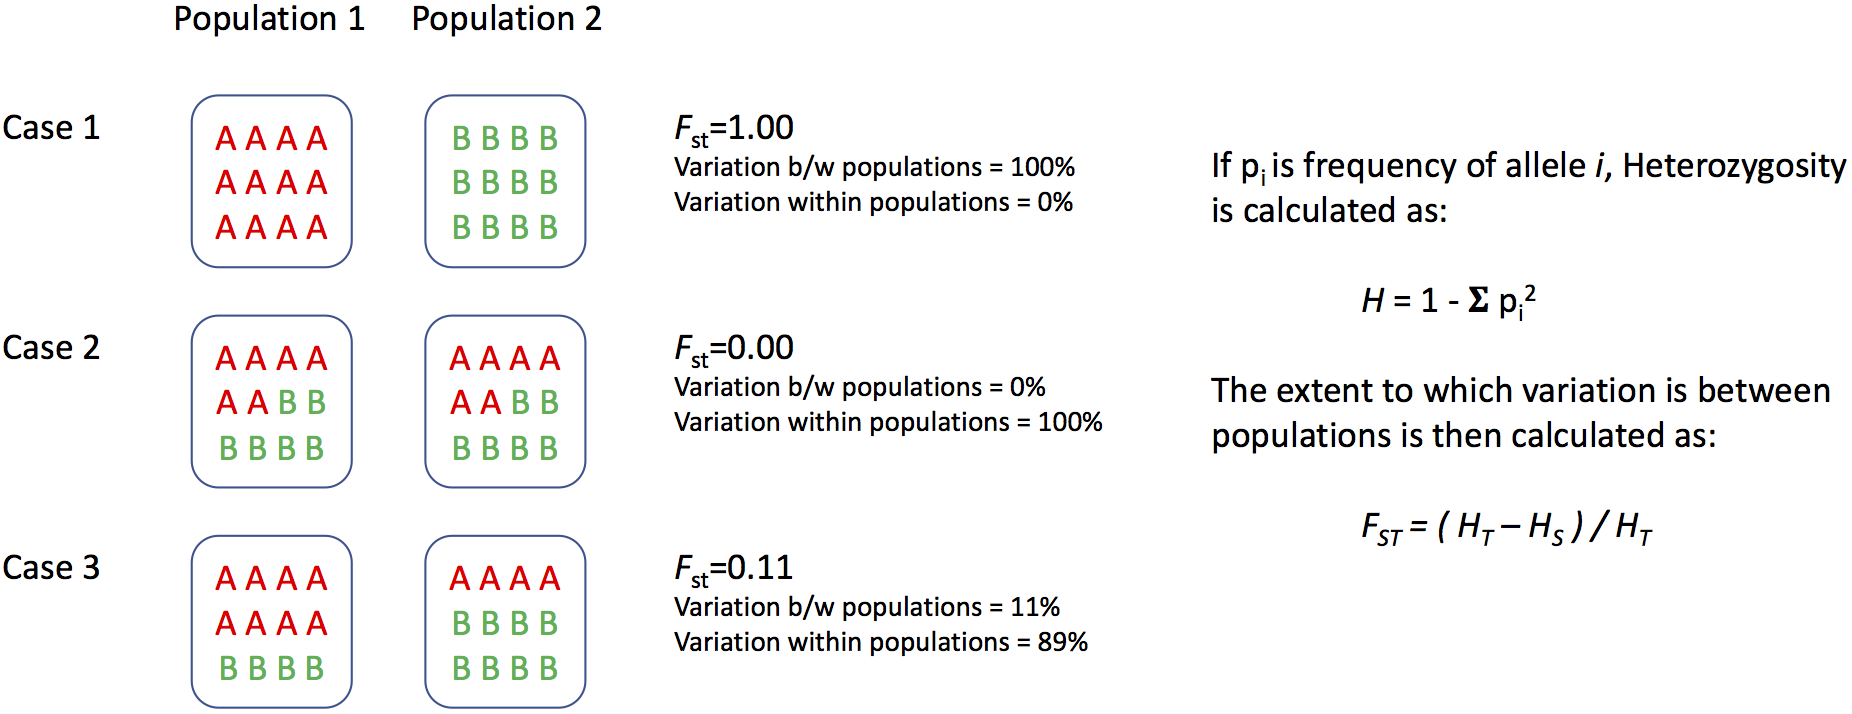
What was FST again?
STRUCTURE analysis
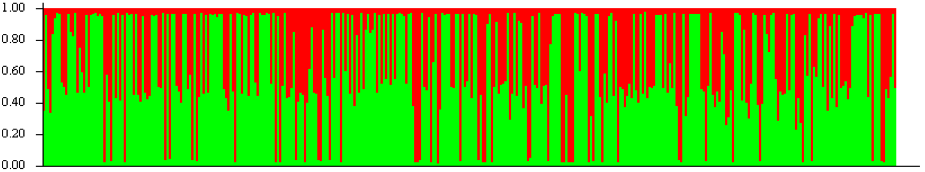
- STRUCTURE analysis attempts to find the optimal number of populations (K) to explain the population genetic patterns
- the highest posterior probability was for K=2, but these two groups did not correspond with host plant nor with locality
- Genotype assignments under K=2. Groups of individuals have been ordered by locality and then host. In other words, the first half of the individuals are from one host, the second half from the other. We conclude that host does not affect population stucture.