mebioda
Simple tree shape metrics: imbalance, branchiness
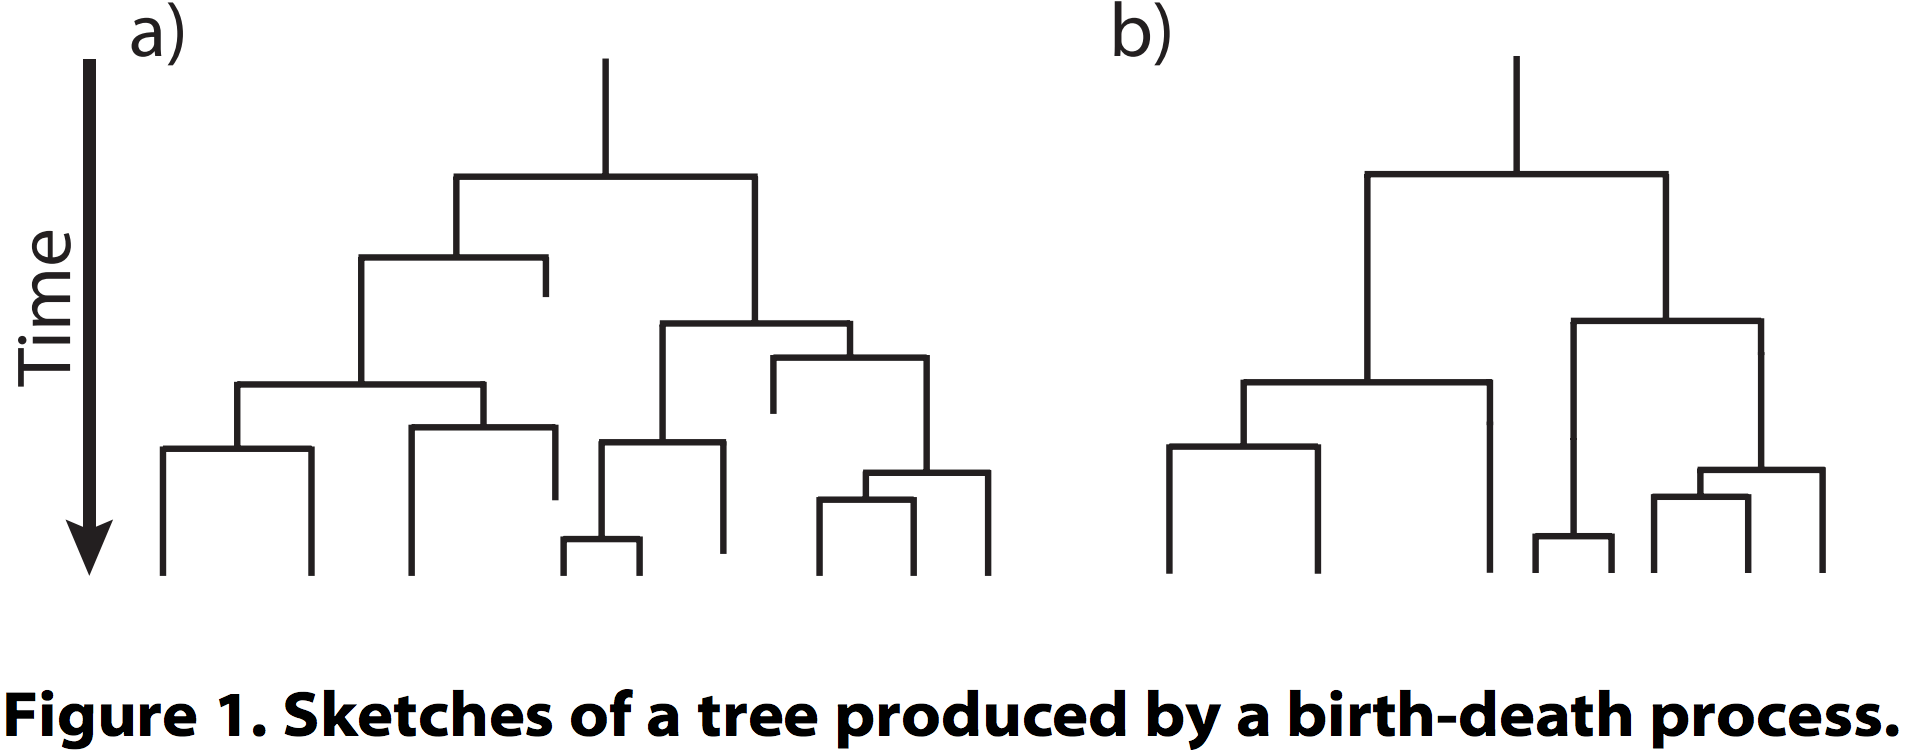
- Fundamental models of diversification: Yule (pure birth) and birth/death
- Simple metrics to express rate variation through time: Pybus’s γ (and others)
- Simple metrics to express lineage-specific rate variation: Colless’s Imbalance (and others)
The Yule process revisited
- We’ve previously seen the Yule process in the context of species delimitation, where certain algorithms (e.g. GMYC) attempt to find the inflection point between diversification (Yule) and population-genetic (Coalescent) processes.
- The process assumes that every lineage is equally likely to speciate at any given time.
- Hence, the more lineages there are, the shorter the waiting time till the next speciation, because there are more lineages playing the lottery.
- The average expected waiting time till the next speciation is therefore 1/n (or any given waiting time, when simulating, is drawn from an exponential distribution).

Birth/death processes
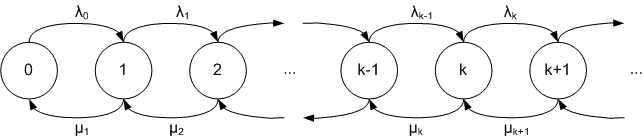
- In the simplest birth/death processes, an additional parameter determines the probability with which every lineage is to go extinct at any given time.
- The net diversification rate is thus
speciation - extinction. - (In simulations this rate should obviously be positive, so the extinction rate should be smaller than the birth rate in order for there to grow a tree.)
Diversification through time
But, is net diversification rate (speciation-extinction) constant through time? We might expect ecological opportunities to arise, triggering adaptive radiations, processes that we might visualize, qualitatively, as lineage-through-time plots:
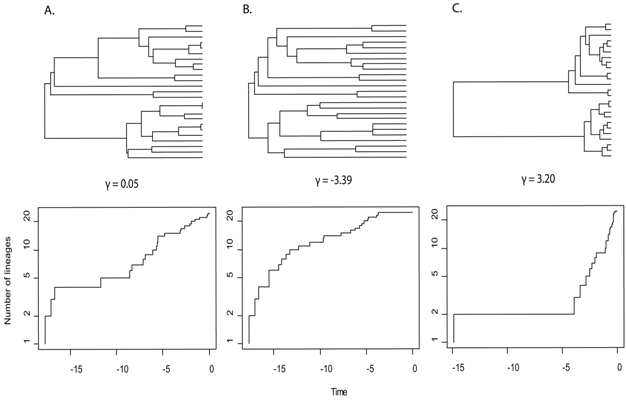
- (A) Even rates through time, the null hypothesis for patterns of diversification (γ = 0.05).
- (B) Early burst of cladogenesis and species accumulation, the expected pattern under Ecological Opportunity (γ = -3.39).
- (C) Late burst of speciation or early extinction (γ = 3.20).
The tendency of nodes
Pybus, OG & Harvey, PH, 2000. Testing macro-evolutionary models using incomplete molecular phylogenies. Proc. R. Soc. Lond. B 267, 2267-2272
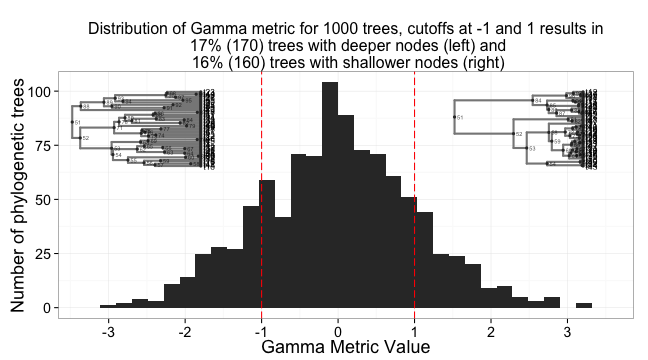
- A tree branching under a constant-rates model should have a balance of node depths γ around the midpoint (in depth) of the tree
- This γ is normally distributed around a mean of zero. Negative values capture early diversification, positive values capture, either, late diversification or higher extinction, especially early on.
library(ape)
tree <- read.tree(text="((A:0.5,B:0.5):1,C:1.5);")
gamma <- gammaStat(tree)

# P-value for two-tailed test of deviation
2*(1 - pnorm(abs(gamma)))

# one-tailed test
1 - pnorm(abs(gamma))
Lineage-specific processes
Numerous other metrics have been developed to capture the extent to which nodes are concentrated near the tips or near the root, e.g.:
- Fiala, KL and RR Sokal, 1985. Factors determining the accuracy of cladogram estimation: evaluation using computer simulation. Evolution, 39: 609-622
- Rohlf, FJ, WS Chang, RR Sokal, J Kim, 1990. Accuracy of estimated phylogenies: effects of tree topology and evolutionary model. Evolution, 44(6): 1671-1684
However, these metrics do not capture whether there are imbalances between lineages, e.g. because one is (heritably?) more likely to diversify:
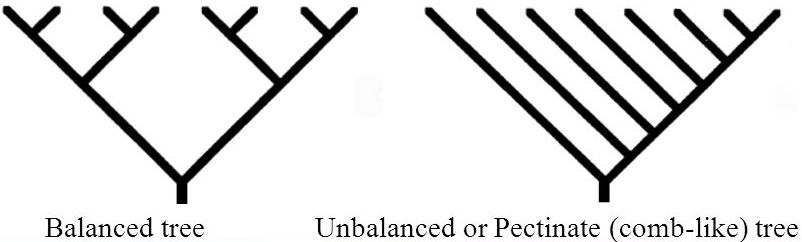
Colless’ imbalance
Colless, DH, 1982. The theory and practice of phylogenetic systematics. Systematic Zoology 31(1): 100-104
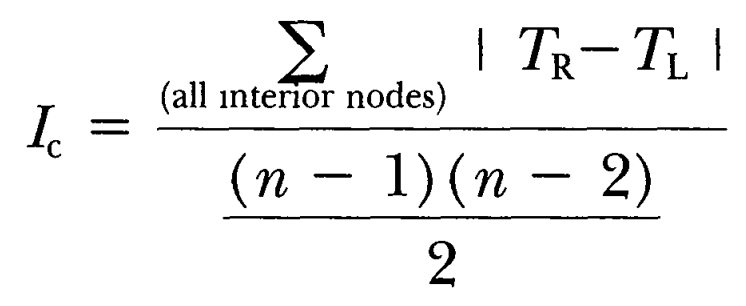
Add up, for all (n-1) nodes in a tree with n tips, the absolute difference between the tips subtended by the child “on the left” and that of the child on the right (i.e. | TR - TL |). Then, normalize this value by dividing through the maximum value for a tree that size, which is ((n-1)*(n-2))/2
This value can be computed in R using ape and apTreeShape thusly:
library(ape)
library(apTreeshape)
tree <- read.tree(text="((A,B),C);")
aptree <- as.treeshape(tree)
ic <- colless(aptree)
I2 imbalance
Mooers AO & Heard SB, 1997. Inferring evolutionary process from phylogenetic tree shape. Quarterly Review of Biology 72: 31–54.
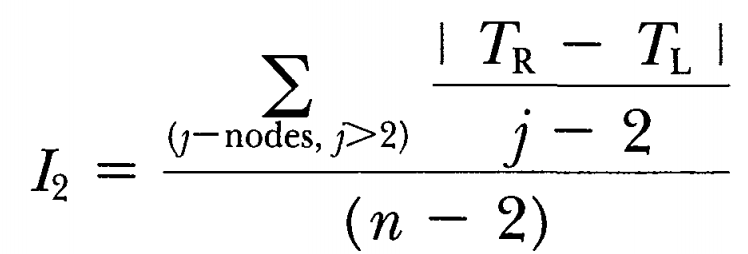
A perhaps reasonable critique of the IC index is that it weights “deep” nodes heavier (consider how the diff between left and right may be much higher for deep nodes than for shallow ones). An alternative index might therefore, as in this case, normalize each node right away using j = the number of tips subtended by the focal node.
Which one might compute, for example, thusly:
use Bio::Phylo::IO 'parse_tree';
$ic = parse_tree(
	'-format' => 'newick',
	'-string' => '((A,B),C);',
)->calc_i2;
Empirical results for tree balance
Simulating sets of trees with different topological properties
Scott Chamberlain, of rOpenSci has developed a nice RMarkdown document that demonstrates simulating sets of trees, filtered for different tree topology metrics. See what the distributions look like if the input trees aren’t Yule but birth/death.