mebioda
Functional diversity
Functional trait example: Leaf Area Index


Characters versus traits

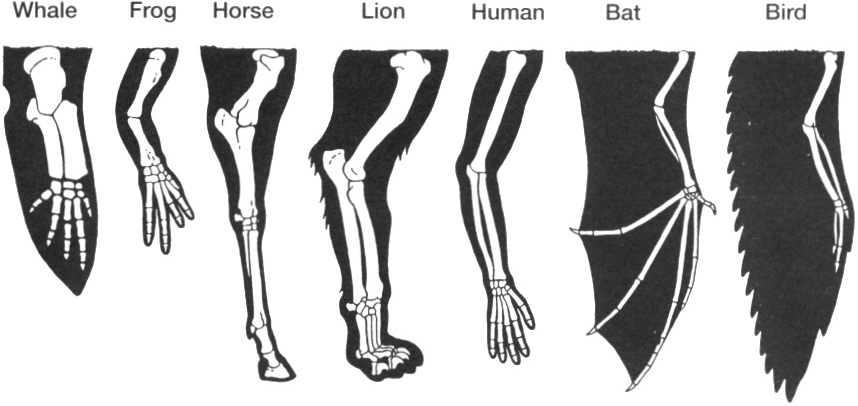
A character applies to a feature that is homologous across species, and so the distribution of states follows phylogeny. A trait applies to ecological function with no strong assumption of homology.
- Characters are expected to have less homoplasy than traits
- Or, conversely, characters usually have more phylogenetic conservatism than traits
- Synapomorphy, autapomorphy and symplesiomorphy are relevant in character analysis but not in functional trait analysis
Phylogenetic conservatism

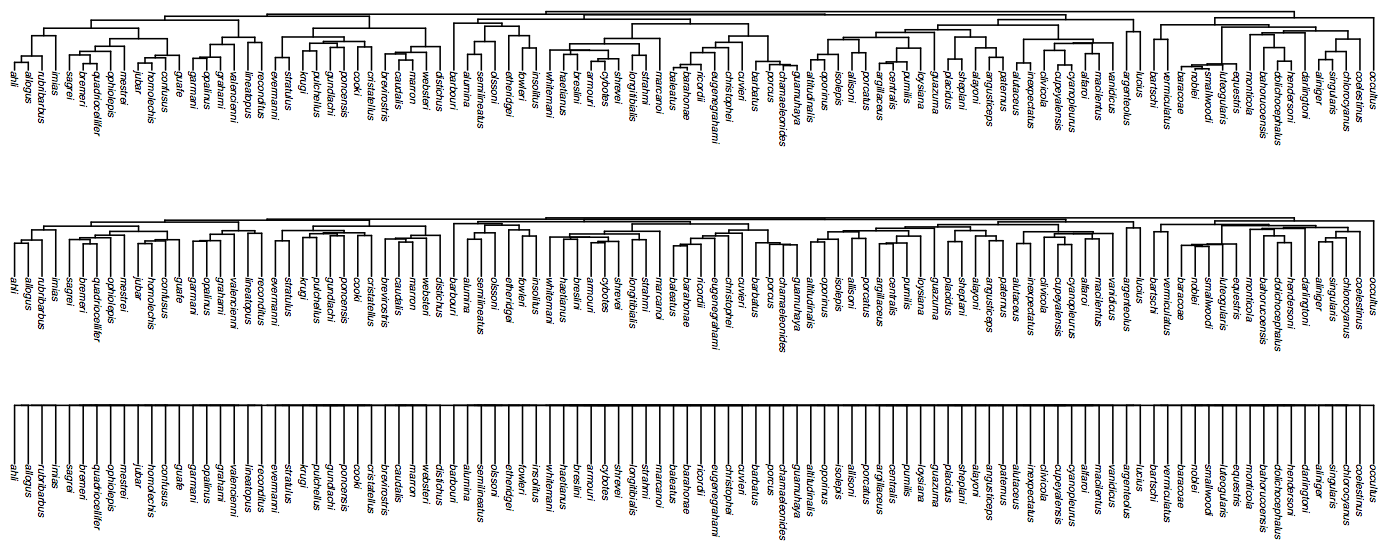
- The strength of the phylogenetic signal (or, the amount of phylogenetic conservatism) can be expressed, for example, using Pagel’s λ.
- The index λ is the MLE for branch length transformation that best fits the data. If there is no phylogenetic signal (no covariation at all), internal branches can all be collapsed, corresponding with λ=0.
- If there is strong phylogenetic signal, internal branches must not be collapsed, so the MLE for λ=1.
Niche conservatism
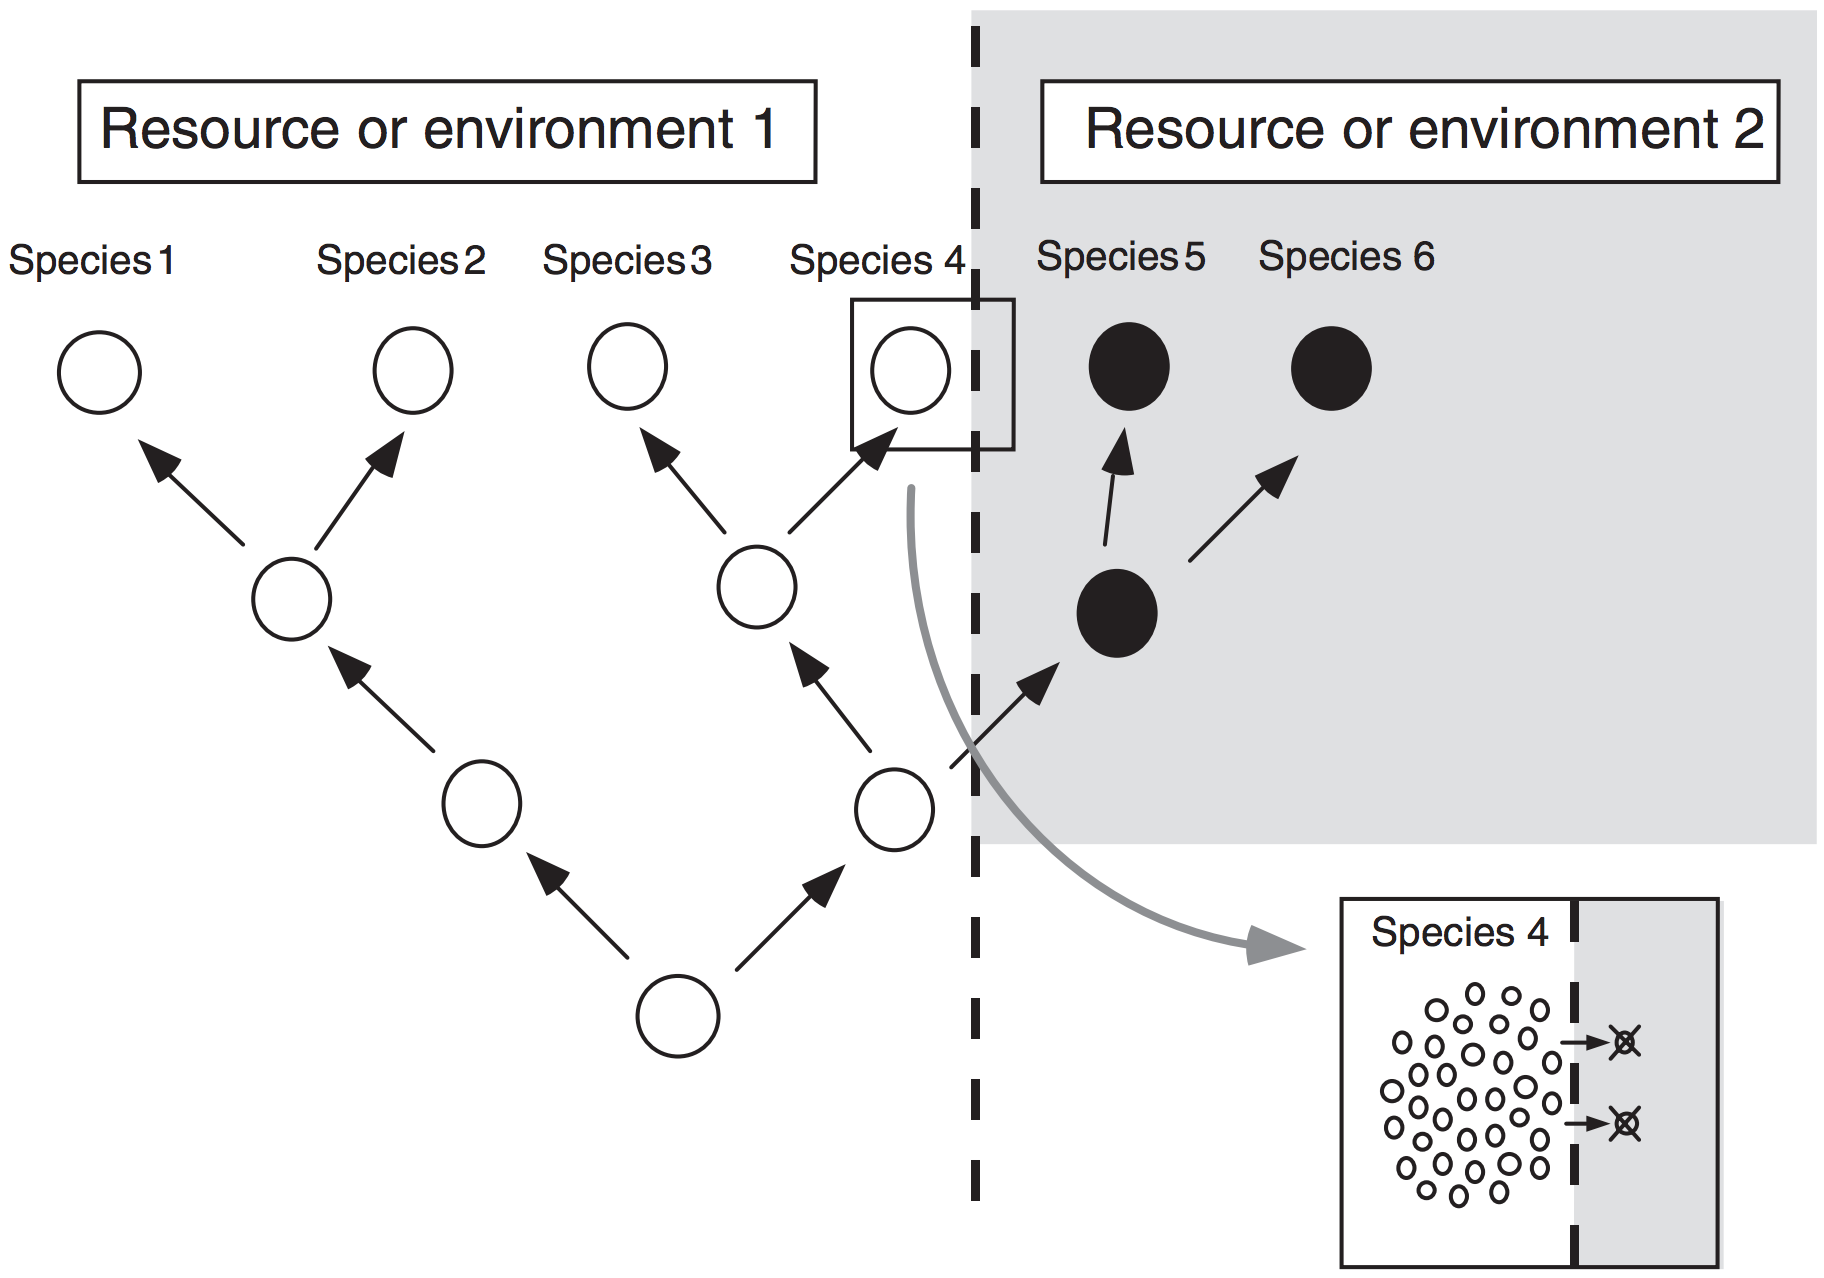
What is a “niche”? What’s the difference between potential and realized niche? What processes maintain the dimensions of a species’ niche?
JJ Wiens et al., 2010. Niche conservatism as an emerging principle in ecology and conservation biology. Ecology Letters 13(10): 1310–1324 doi:10.1111/j.1461-0248.2010.01515.x

Whereas characters are selected based on the general assumption that evolutionary change is inherently rare (i.e. “maximum parsimony”), conservatism in functional traits related to the niche is thought to be actively maintained by natural selection.
Functional diversity of communities
NWH Mason et al. 2005. Functional richness, functional evenness and functional divergence: the primary components of functional diversity. Oikos 111(1): 112–118 doi:10.1111/j.0030-1299.2005.13886.x

- The vertical axes represent abundance (e.g. biomass).
- The bell-shaped curves indicate the distribution of the abundance of individual species in niche space.
- The histograms indicate the summed abundance of the species occurring in each functional character category (i.e. equal-width sections of the functional character range).
- The vertical dotted lines indicate the amount of niche space filled by the species together.
- Functional richness can decrease without a change in functional evenness if the evenness of abundance within the niche space is unchanged (going from B to A1).
- Similarly, functional evenness can decrease without a change in functional richness if the amount of niche space filled is unchanged (going from B to C).
Functional dispersion
E Laliberté & P Legendre, 2010. A distance-based framework for measuring functional diversity from multiple traits. Ecology 91:299-305 doi:10.1890/08-2244.1
An example showing how the functional dispersion (FDis), i.e. the functional “spread” of species, is computed.

- The n individual species in a two-dimensional trait space are represented by black circles whose sizes are proportional to their abundances.
- Vector xj represents the position of species j,
- Vector c is the centroid of the n species (white square)
- zj is the distance of species j to centroid c
- aj is the abundance of species j
Panel (a)
- All species have equal abundances (i.e., presence–absence data). In that case, c = [ci], where ci is the mean value of trait i
- FDis is the mean of distances z of individual species to c.
Panel (b)
- Species have different abundances. In that case, the position of c is weighted by the species relative abundances, such that it shifts toward the more abundant species.
- Individual distances z of species to c are weighted by their relative abundances to compute FDis.
Functional turnover between communities
What are α, β, and γ diversity in this context?
NG Swenson, et al., 2011. Deterministic tropical tree community turnover: evidence from patterns of functional beta diversity along an elevational gradient. Proc. R. Soc. B 278(1707):877-884 doi:10.1098/rspb.2010.1369
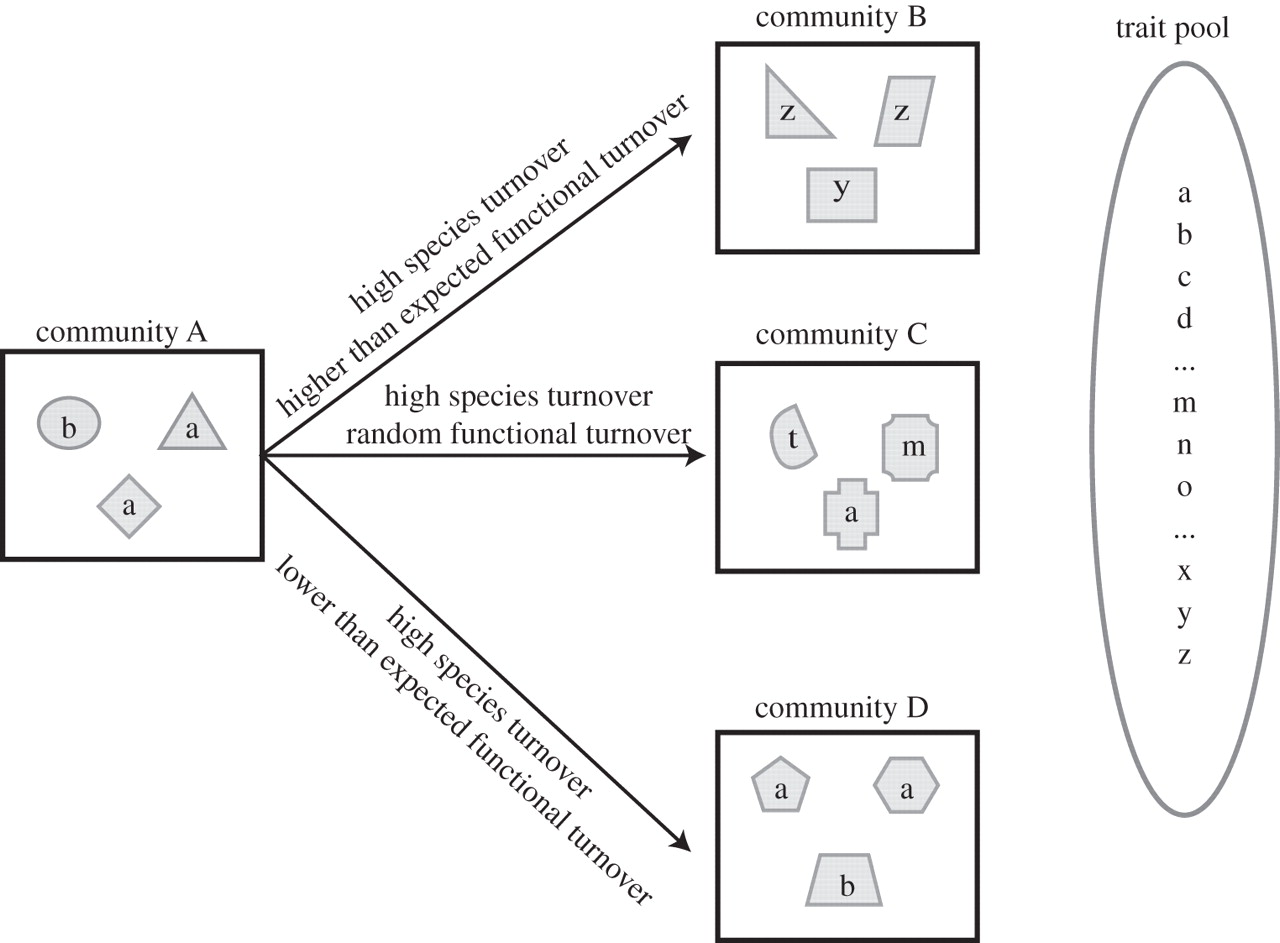
A cartoon depicting the species and functional turnover between a set of four hypothetical communities. The shapes indicate species identity and the letters indicate the functional strategy of the species. The trait pool represents all of the functional strategies that could potentially colonize a community.
The figure illustrates that three different ecological processes can be determined by examining the functional and species turnover between communities simultaneously, while analyses of species turnover alone could provide erroneous ecological inferences.

- Community A shares no species with any of the other communities and therefore has the same species turnover from A ⟶ B, A ⟶ C and A ⟶ D.
- Community A and community B share no functional strategies. Further, the strategies present in B are significantly more dissimilar from those in A than expected if one were to randomly pull three strategies from trait pool. This might be seen if an underlying environmental gradient determines species turnover and community assembly.
- Community A and community C share some functional strategies, but the functional turnover is indistinguishable from a random pull of three functional strategies from the trait pool. This would be expected under a stochastic model of species turnover and community assembly.
- Community A and community D are functionally analogous and there is less functional turnover than expected given a random pull of three strategies from the trait pool. This would be expected where dispersal is limited but community assembly is deterministic with respect to the environment.