GIS datasets
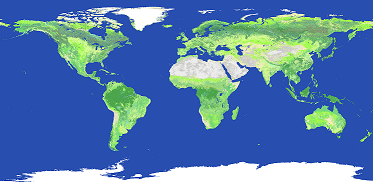
Land Cover (GLCNMO) - Global version
Metadata
- Data source: MODIS data 2013 (Terra & Aqua)
- Coordinate system: WGS84
- Resolution: 15 arcseconds
- Data type: Byte (8bits, Little end ordering (Intel x86))
Classes
- Broadleaf Evergreen Forest
- Broadleaf Deciduous Forest
- Needleleaf Evergreen Forest
- Needleleaf Deciduous Forest
- Mixed Forest
- Tree Open
- Shrub
- Herbaceous
- Herbaceous with Sparse Tree/Shrub
- Sparse vegetation
- Cropland
- Paddy field
- Cropland / Other Vegetation Mosaic
- Mangrove
- Wetland
- Bare area, consolidated (gravel,rock)
- Bare area, unconsolidated (sand)
- Urban
- Snow / Ice
- Water bodies
Ecoregions

Metadata
Shape file: https://storage.googleapis.com/teow2016/Ecoregions2017.zip
Classes
- Boreal Forests/Taiga
- Deserts & Xeric Shrublands
- Flooded Grasslands & Savannas
- Mangroves
- Mediterranean Forests, Woodlands & Scrub
- Montane Grasslands & Shrublands
- Rock and Ice
- Temperate Broadleaf & Mixed Forests
- Temperate Conifer Forests
- Temperate Grasslands, Savannas & Shrublands
- Tropical & Subtropical Coniferous Forests
- Tropical & Subtropical Dry Broadleaf Forests
- Tropical & Subtropical Grasslands, Savannas & Shrublands
- Tropical & Subtropical Moist Broadleaf Forests
- Tundra
Climate
Both the Bioclim dataset and the ENVIREM dataset are used as climatic variables.
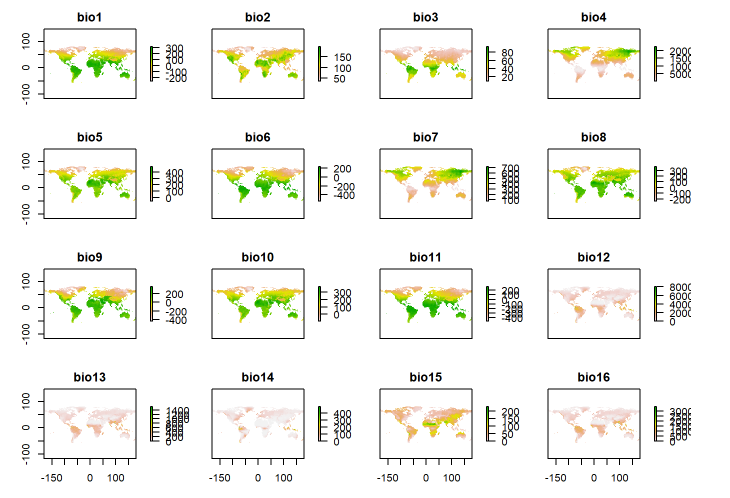
Datasets Bioclim
- BIO1 Annual Mean Temperature
- BIO2 Mean Diurnal Range (Mean of monthly (max temp - min temp))
- BIO3 Isothermality (BIO2/BIO7) (* 100)
- BIO4 Temperature Seasonality (standard deviation *100)
- BIO5 Max Temperature of Warmest Month
- BIO6 Min Temperature of Coldest Month
- BIO7 Temperature Annual Range (BIO5-BIO6)
- BIO8 Mean Temperature of Wettest Quarter
- BIO9 Mean Temperature of Driest Quarter
- BIO10 Mean Temperature of Warmest Quarter
- BIO11 Mean Temperature of Coldest Quarter
- BIO12 Annual Precipitation
- BIO13 Precipitation of Wettest Month
- BIO14 Precipitation of Driest Month
- BIO15 Precipitation Seasonality (Coefficient of Variation)
- BIO16 Precipitation of Wettest Quarter
- BIO17 Precipitation of Driest Quarter
- BIO18 Precipitation of Warmest Quarter
- BIO19 Precipitation of Coldest Quarter
Datasets ENVIREM
- annualPET Annual potential evapotranspiration
- aridityIndexThornthwaite Thornthwaite aridity index
- climaticMoistureIndex Metric of relative wetness and aridity
- continentality Average temp. of warmest and coldest month
- embergerQ Emberger’s pluviothermic quotient
- growingDegDays0 Sum of months with temperatures greater than 0 degrees
- growingDegDays5 Sum of months with temperatures greater than 5 degrees
- maxTempColdestMonth Maximum temp. of the coldest month
- minTempWarmestMonth Minimum temp. of the warmest month
- monthCountByTemp10 Sum of months with temperatures greater than 10 degrees
- PETColdestQuarter Mean monthly PET of coldest quarter
- PETDriestQuarter Mean monthly PET of driest quarter
- PETseasonality Monthly variability in potential evapotranspiration
- PETWarmestQuarter Mean monthly PET of warmest quarter
- PETWettestQuarter Mean monthly PET of wettest quarter
- thermInd Compensated thermicity index
Topography
Median elevation variables were extracted from the Harmonized World Soil Database and have a spatial resolution of 30 arcseconds. The topographic wetness index and the terrain roughness index are extracted from the ENVIREM dataset and have a spatial resolution of 30 arcseconds.
Datasets
- Slope
- Aspect
- Topographic wetness index
- Terrain roughness index

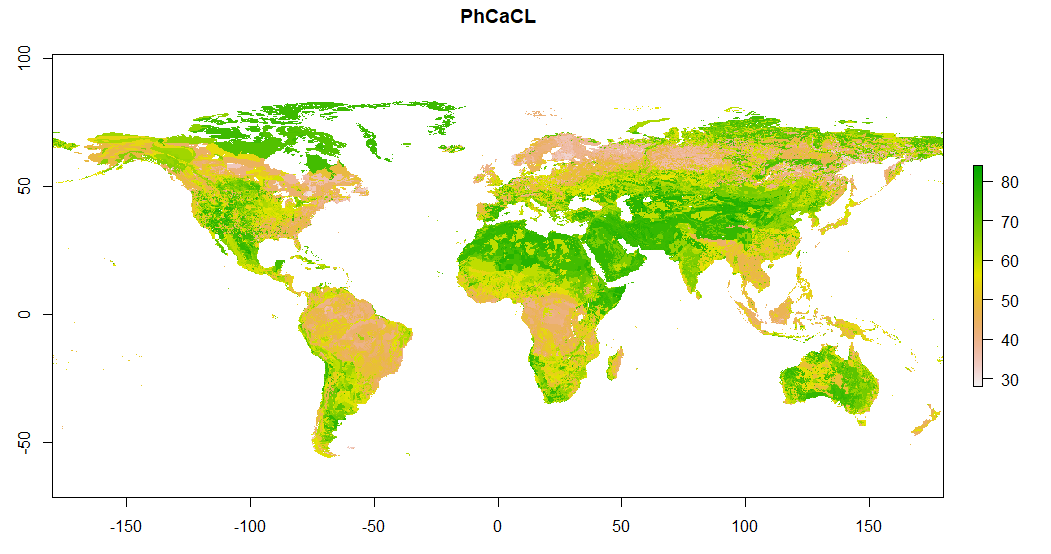
Soil
The soil characteristics are extracted from the Land-Atmosphere Interaction Research Group with a spatial resolution of 5 arcminutes.
- Bulk density
- Clay percentage
- pH CaCL
- Organic carbon