mebioda
Topological analysis
G-D Yang, P-M Agapow & G Yedi, 2017. The tree balance signature of mass extinction is erased by continued evolution in clades of constrained size with trait-dependent speciation. PLoS ONE 12(6): e0179553 doi:10.1371/journal.pone.0179553
- What happens to the signatures of mass extinctions or radiations (such as imbalance or “stemminess”)?
- Wouldn’t they eventually be swamped?
- What can we learn from simulation?
Experimental evolution using Avida

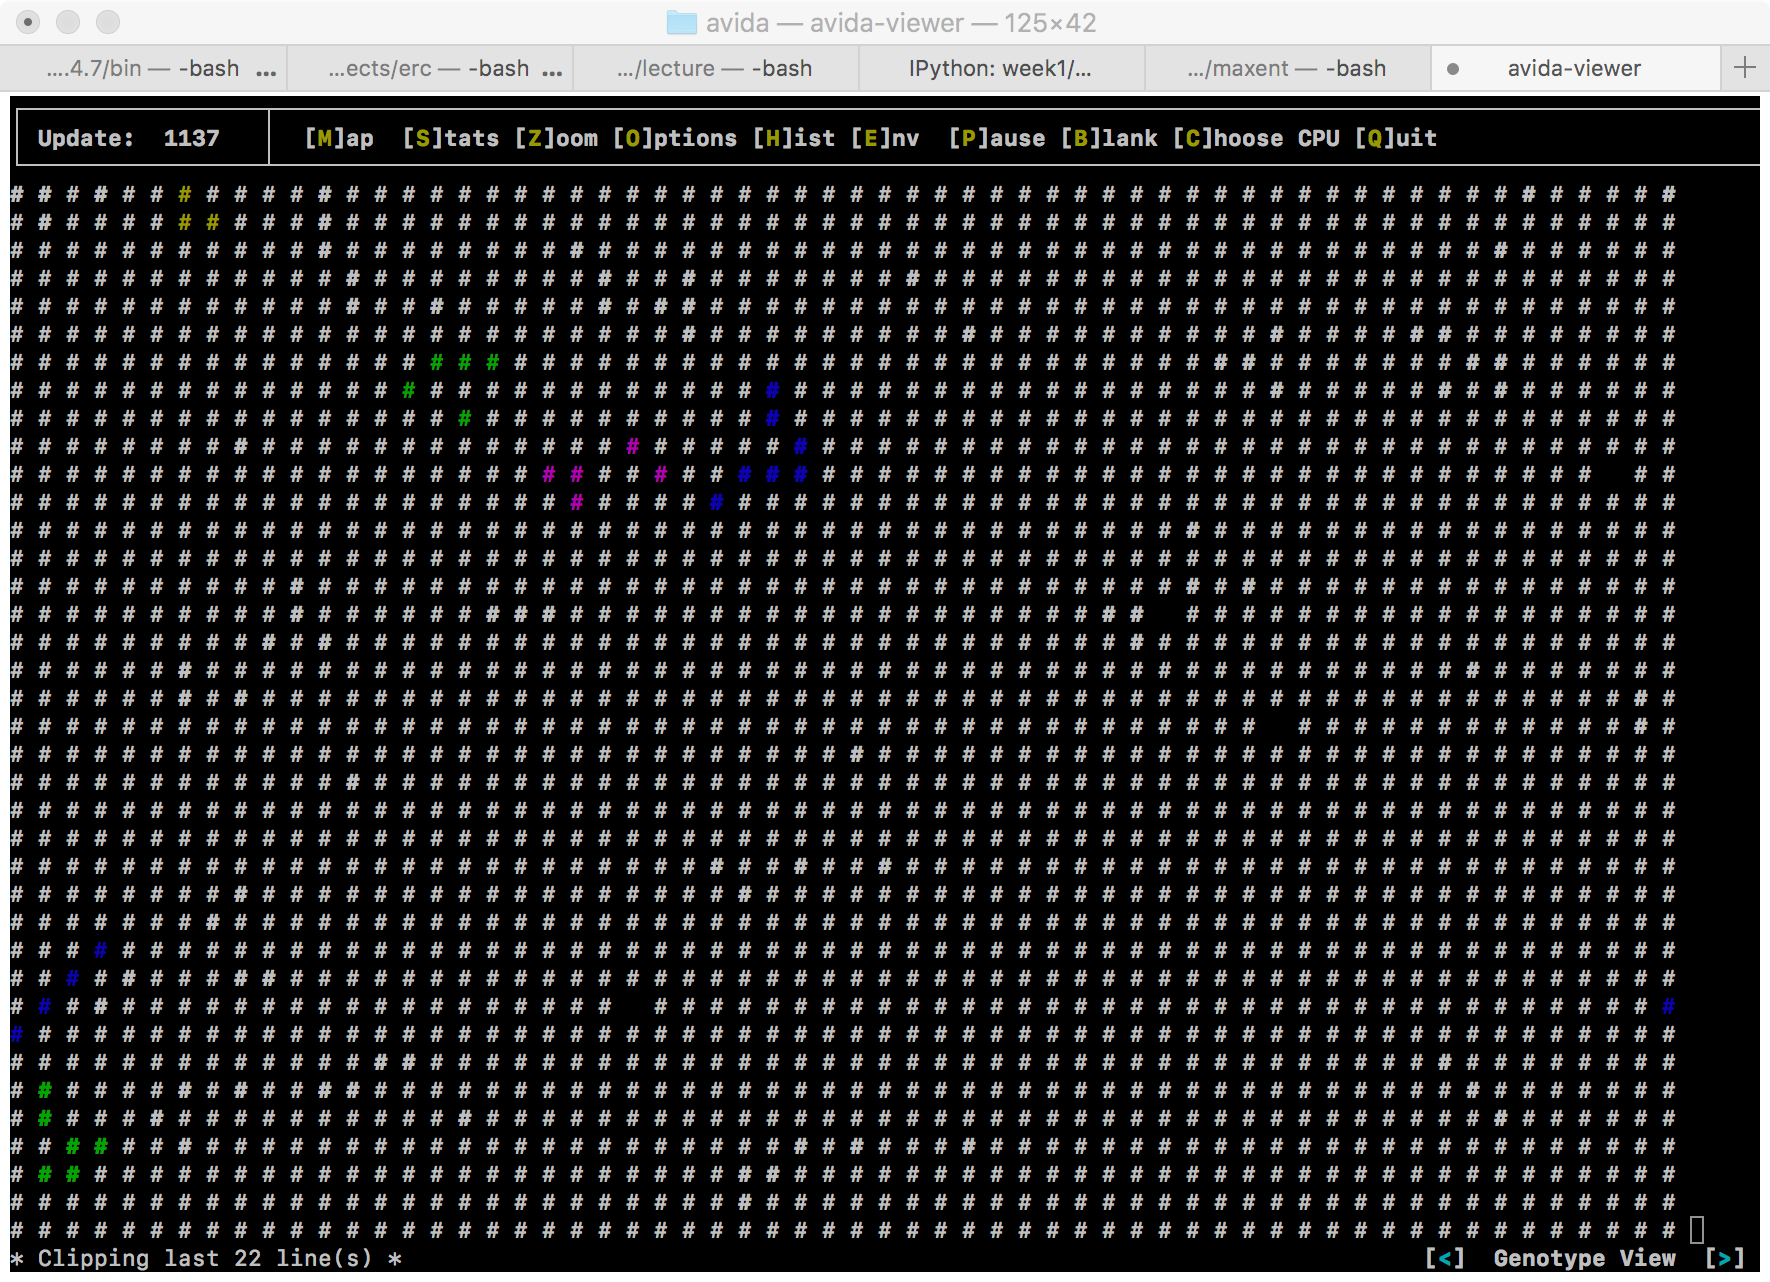
Avida is a free, open source scientific software platform for conducting and analyzing experiments with self-replicating and evolving computer programs. It provides detailed control over experimental settings and protocols, a large array of measurement tools, and sophisticated methods to analyze and post-process experimental data.
Effect on tree balance of mass extinction

Change in tree balance at select time points after mass extinction episode in communities of avida digital organisms.
- Mass extinction treatments were applied randomly and instantaneously (pulse) or by massive environmental change over a period of time (press), at strong and weak intensities.
- The y-axis is Aldous’s β [βA] a measure of tree balance applicable to non-dichotomous trees; a Yule expectation is around zero, while more negative values indicate trees more imbalanced than this expectation.
- Data points are averages of 100 replicates ± 2 standard errors. Solid traces are
maximum likelihood estimates of βA, dashed traces are 95% confidence
intervals around the calculated βA estimates. βA values (with
confidence intervals) were determined using a customized version of the
maxlik.betasplitfunction in the R package apTreeshape (courtesy M. Blum).
Tree simulation using MeSA
- The Avida analyses imply a “recovery” model until saturation, which might swamp sooner
- There is no facility to explore traits interacting with diversification
- More can be accomplished by scripting tree simulations in MeSA

Exemplar phylogenetic trees showing change in balance and trait/rate values over time. Branch lengths are scaled in MeSA absolute time. Tips are coloured according to trait value ranges shown in colour scale at bottom.
- a) t = 165, trait variance approximately 1, increasing
- b) t = 320, trait variance at half-maximum, increasing
- c) t = 400, maximum variance
- d) t = 420, half-maximum, descending
- e) t = 520, variance < 1 but still strong imbalance, descending.
- f) t = 600, variance at end-simulation
Parameterization of the extinction events
Three mass extinction treatments were employed:
- Random = taxa were culled from the tree regardeless of trait value or phylogenetic position.
- Selective-on-diversifiers = taxa culled from the tree had the lowes trait value and highest speciation rates.
- Selective-on-relicts = those taxa with highest trait value and lowest speciation rates were culled preferentally.
Each of the treatments occurred at intensity:
- 90%
- 75%
- 50% of all the extant taxa in the tree
Post-simulation analysis

- NEXUS files produced by MeSA were then
manipulated in R to compute Ic values using the function
collessfor each tree in a time series and treatment MESA_output files - The treatments were coded as:
RAND= random extinctionSOD= selective-on-diversifiersSOR= selective-on-relicts- 0.5, 0.75, and 0.9 refer to extinction intensity
- Short-dashed lines above and below the zero line indicate boundaries of inner Yule zone; long-dashed lines indicate outer Yule zone boundaries.
- For the three treatments combined with the different intensities and the control,
Ic values were collected at points:
PRE-EXT= pre extinction time (300)CSR= clade-size recoveryCSR/END 1QTR= simulation first-quarterCSR/END MID= midpointCSR/END 3QTR= three-quarter pointEND SIM= at the end of simulation (600)
- In addition, values were collected at:
- post extinction event (
305) - at the CSR end-mid time (
470)
- post extinction event (
Hypothesis tests

- Ic values were later rearranged in EXCEL and exported in txt files to be used for the statistical analyses.
- The treatments involving a combination of extinction types and intensity were analyzed with two-way ANOVA and Tukey-corrected multiple comparison testing, in order to see if there are any significant treatment-by-intensity interactions.
- To test whether the various extinction treatment outcomes differed systematically from the control and pre-treatment reference points, Dunnett’s tests were perfomed, using either pre-treatment or the control treatment as the reference standard.
“We cannot solely use tree balance metrics to infer past history of mass extinction for a given extant clade’s phylogeny. […] our results are a further demonstration that as an evolving clade gets further away from a mass extinction event, subsequent evolution can obscure and eventually erase the initial phylogenetic effects caused by the extinction/recovery process.”